EvoDesign Protocol: A Step-by-Step Guide to AI-Driven Protein Optimization for Drug Discovery
This comprehensive guide introduces the EvoDesign protocol, a sophisticated computational framework for optimizing protein stability, function, and binding affinity.
EvoDesign Protocol: A Step-by-Step Guide to AI-Driven Protein Optimization for Drug Discovery
Abstract
This comprehensive guide introduces the EvoDesign protocol, a sophisticated computational framework for optimizing protein stability, function, and binding affinity. Tailored for researchers and drug development professionals, it explores the evolutionary principles underpinning the method, provides a detailed workflow for practical implementation, addresses common troubleshooting scenarios, and compares its performance against other state-of-the-art protein design tools. The article synthesizes current research to empower scientists in harnessing AI for creating next-generation biologics and enzymes.
What is EvoDesign? Unpacking the Evolutionary Principles of Computational Protein Optimization
EvoDesign represents a paradigm shift in protein engineering, moving from the stochastic, time-consuming process of natural evolution to a targeted, computational design strategy. Its core philosophy posits that the evolutionary sequence record of a protein family encodes the fundamental principles of structure, stability, and function. By extracting these evolutionary constraints and coupling them with physical energy functions, EvoDesign creates a "fitness landscape" to guide the in silico design of novel protein variants with enhanced or entirely new properties.
Within the broader thesis on the EvoDesign protocol, this document provides the essential application notes and experimental protocols for implementing this philosophy in protein optimization research, focusing on stability enhancement and functional repurposing.
Quantitative Foundations: Key Metrics & Data
The efficacy of the EvoDesign protocol is validated through benchmark studies comparing designed sequences to natural and random variants. Key quantitative metrics are summarized below.
Table 1: Benchmark Performance of EvoDesign vs. Alternative Methods
| Metric | EvoDesign Protocol | Traditional Directed Evolution | Purely Physics-Based Design (Rosetta) | Random Mutation |
|---|---|---|---|---|
| Sequence Identity to WT (%) | 60 - 85 | 99.9+ | 30 - 50 | Variable |
| Predicted ΔΔG (kcal/mol) | -1.5 to -4.0 | Not Applicable | -2.0 to -5.0 | +0.5 to +3.0 |
| Success Rate (Stabilizing Designs) | ~70% | <0.1% (per round) | ~40% | <5% |
| Computational Time per Design | 2-8 GPU hours | N/A | 10-50 CPU hours | N/A |
| Experimental Validation Rate | 60-80% | Requires screening | 20-50% | Requires screening |
| Key Strength | Evolutionarily informed, high fitness | Guaranteed functionality | Novel scaffold exploration | Baseline control |
Table 2: Typical Experimental Output for EvoDesign-Optimized Proteins
| Protein Target | Designed Mutations | Measured ΔTm (°C) | Activity Retention (%) | Primary Application Goal |
|---|---|---|---|---|
| Subtilisin Protease | A12S, N26D, S49G, I107L | +8.5 | 110 | Thermostability |
| Green Fluorescent Protein | S30R, Y39H, T105I, S205T | +6.2 | 95 | Folding Efficiency |
| TIM Barrel Enzyme | K8E, D47N, H129Q, R180S | +11.3 | 85 | pH Stability |
| Single-Domain Antibody | V17I, S53T, A78V, H102Y | +7.1 | 100 | Aggregation Resistance |
Detailed Experimental Protocols
Protocol 3.1: In Silico Design Phase using EvoDesign Server/Workflow
Objective: Generate a rank-ordered list of optimized protein sequences based on evolutionary and energy constraints.
Materials:
- Input: Wild-type (WT) protein atomic coordinates (PDB file) or a high-quality structural model.
- Software: Local installation of EvoDesign suite or access to web server (e.g., EvoDesign v2.0).
- Hardware: Multi-core CPU/GPU cluster recommended for large-scale designs.
Methodology:
- Sequence Alignment & Profile Construction:
- Use PSI-BLAST or HHblits against the NR database with the WT sequence as query (E-value cutoff: 1e-10, 3 iterations).
- Filter alignment to <75% pairwise identity. Generate a Position-Specific Scoring Matrix (PSSM) and a frequency matrix.
- Structural Preparation:
- Clean the PDB file: remove water, ions, and heteroatoms. Add missing hydrogen atoms.
- Define the "designable" residues (typically solvent-exposed, non-catalytic sites). Define "fixed" residues (catalytic triad, key binding residues).
- EvoDesign Simulation:
- Run the
EvoDesigncommand with the following core parameters: - The algorithm performs Monte Carlo simulations, scoring each sequence variant with the combined fitness function:
Fitness = w1 * Evolutionary_Score + w2 * Physics_Energy.
- Run the
- Output Analysis:
- The output is a list of top-scoring sequences (typically top 100). Analyze mutation patterns for consensus and proximity in 3D space.
- Select 5-10 diverse sequences for in vitro testing, prioritizing those with high fitness scores and plausible structural interactions.
Protocol 3.2: Experimental Validation of Designed Thermostability
Objective: Express, purify, and biophysically characterize selected EvoDesign variants to measure stability enhancement.
Materials: See "The Scientist's Toolkit" below for key reagents.
Methodology:
- Gene Synthesis & Cloning:
- Synthesize genes encoding the WT and selected EvoDesign variants with optimal codon usage for the expression system (e.g., E. coli).
- Clone into an appropriate expression vector (e.g., pET series with N-terminal His-tag) using restriction-free or Gibson assembly.
- Protein Expression & Purification:
- Transform plasmids into expression host (e.g., BL21(DE3)). Grow cultures in LB at 37°C to OD600 ~0.6-0.8.
- Induce with 0.5-1.0 mM IPTG. Express at 18°C for 16-18 hours.
- Pellet cells, lyse via sonication in lysis buffer (e.g., 50 mM Tris pH 8.0, 300 mM NaCl, 10 mM imidazole, 1 mM PMSF).
- Purify soluble protein via Ni-NTA affinity chromatography, followed by size-exclusion chromatography (SEC) in a suitable assay buffer (e.g., 20 mM HEPES pH 7.4, 150 mM NaCl).
- Thermal Shift Assay (Differential Scanning Fluorimetry, DSF):
- Mix 5 µM protein with 5X SYPRO Orange dye in a 20 µL reaction in a qPCR plate.
- Run a temperature ramp from 25°C to 95°C at a rate of 1°C/min in a real-time PCR instrument, monitoring fluorescence.
- Determine the melting temperature (Tm) from the first derivative of the fluorescence curve. ΔTm = Tm(variant) - Tm(WT).
- Differential Scanning Calorimetry (DSC) (Gold Standard):
- Dialyze SEC-purified protein (>0.5 mg/mL) extensively against assay buffer.
- Load sample and reference (buffer) into the calorimeter cell.
- Run a heating scan (e.g., 20°C to 100°C at 1°C/min). Fit the thermogram to a non-two-state model to obtain the unfolding enthalpy (ΔH) and Tm.
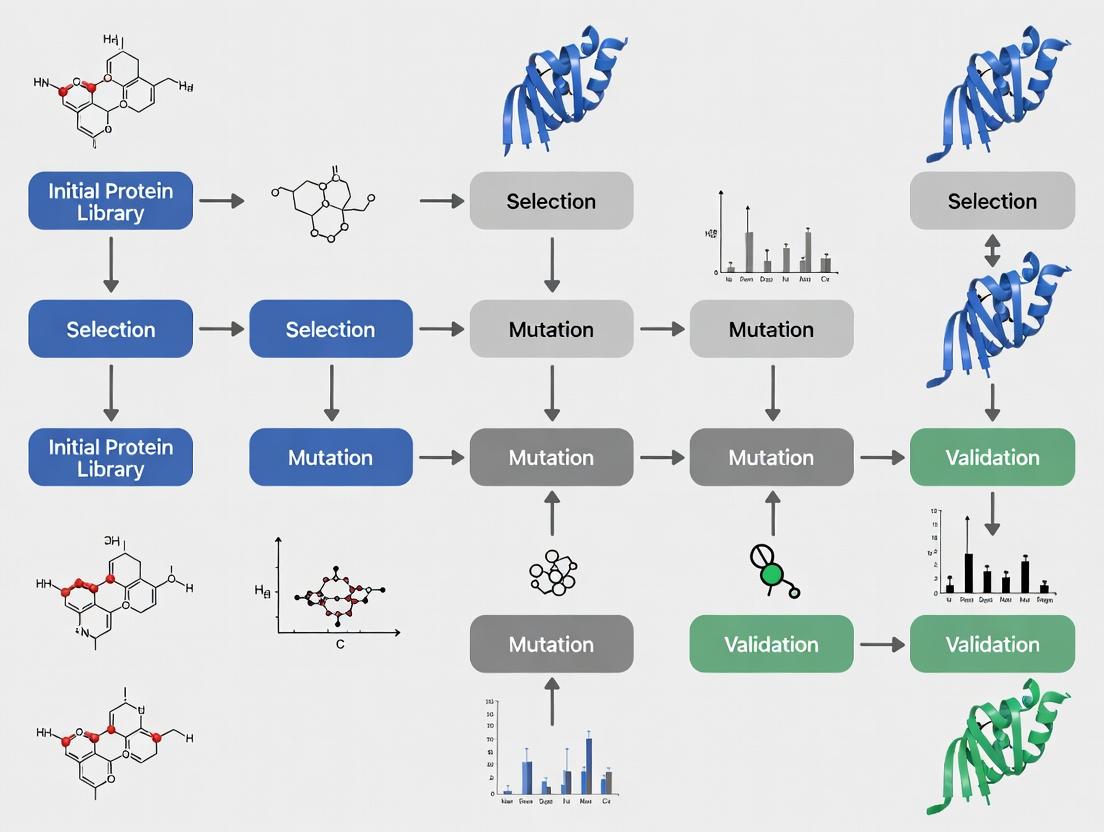
Visualizations
Title: The EvoDesign Computational Workflow Logic
Title: Step-by-Step EvoDesign In Silico Protocol
The Scientist's Toolkit
Table 3: Essential Research Reagents & Materials for EvoDesign Validation
| Item | Function / Description | Example Product/Catalog |
|---|---|---|
| Gene Fragments | Codon-optimized double-stranded DNA encoding the designed sequences. | IDT gBlocks, Twist Bioscience genes |
| Expression Vector | Plasmid for controlled, high-level protein expression in the chosen host. | pET-28a(+) (Novagen), with T7 promoter & His-tag |
| Competent Cells | Genetically engineered E. coli for transformation and protein expression. | NEB Turbo, BL21(DE3), or Rosetta2(DE3) |
| Affinity Resin | For rapid, tag-based purification of recombinant proteins. | Ni-NTA Agarose (Qiagen), HisPur Cobalt Resin (Thermo) |
| Size-Exclusion Column | For final polishing and buffer exchange into assay-compatible buffer. | HiLoad 16/600 Superdex 75 pg (Cytiva) |
| Fluorescent Dye (DSF) | Binds hydrophobic patches exposed during thermal unfolding. | SYPRO Orange Protein Gel Stain (Invitrogen) |
| Calorimetry Cell | High-sensitivity vessel for measuring heat changes during unfolding. | VP-DSC Capillary Cell (Malvern Panalytical) |
| Activity Assay Substrate | Validates functional retention post-optimization (target-specific). | e.g., Para-nitrophenyl acetate for esterases |
Within the thesis on the EvoDesign protocol for protein optimization, this document details the core computational modules that synergize to enable the de novo design and optimization of protein structures with desired functions. EvoDesign integrates evolutionary information with atomic-level physical energy calculations to navigate the vast sequence space efficiently. This application note provides protocols and implementation details for its three key components.
Energy Functions
Energy functions form the scoring bedrock of the EvoDesign framework, evaluating the thermodynamic stability and fitness of designed protein models. They combine knowledge-based statistical potentials with physics-based force fields.
Composite Energy Function Equation
The total energy score (E_total) for a protein model is typically a weighted sum: E_total = w_evo * E_evo + w_fold * E_fold + w_surface * E_surface + w_pair * E_pair
Component Definitions & Protocols
Protocol 1.1: Calculating Knowledge-Based Evolutionary Potential (E_evo)
- Objective: To score how well a proposed sequence aligns with the evolutionary preferences derived from a homologous sequence family.
- Procedure:
- Input: Target protein backbone structure and a multiple sequence alignment (MSA) of homologs.
- Build Position-Specific Scoring Matrix (PSSM): Compute log-odds frequencies for each amino acid at each position of the MSA using PSI-BLAST against the NR database.
- Map Sequence to Structure: Thread the designed amino acid sequence onto the target backbone.
- Calculate E_evo: Sum the PSSM-derived log-likelihood scores for the amino acid placed at each corresponding structural position. Higher scores indicate better evolutionary compatibility.
- Data Source: NCBI BLAST/PSI-BLAST servers (current version).
Protocol 1.2: Calculating Atomic-Level Fold Stability (E_fold)
- Objective: To evaluate the intrinsic physicochemical stability of the folded protein model.
- Procedure:
- Input: All-atom or coarse-grained model of the designed protein.
- Select Force Field: Employ a physics-based energy function such as Rosetta's REF2015 or the CHARMM36m force field.
- Minimize Structure: Perform gradient-based energy minimization to relieve steric clashes.
- Calculate Efold: Compute the sum of van der Waals, solvation, hydrogen bonding, and electrostatic interaction energies. A lower (more negative) Efold indicates higher stability.
- Reagent Solution: Rosetta Software Suite or GROMACS/CHARMM for molecular mechanics.
Quantitative Comparison of Energy Terms
Table 1: Characteristics of Primary Energy Functions in EvoDesign
| Energy Component (Symbol) | Type | Computational Cost | Key Role | Optimal Value Direction |
|---|---|---|---|---|
| Evolutionary Potential (E_evo) | Knowledge-based, Statistical | Low | Ensures native-like, functional sequences | Maximize |
| Fold Stability (E_fold) | Physics-based, Atomic | Very High | Ensures thermodynamic stability | Minimize |
| Surface & Pair Potentials (E_surface/pair) | Knowledge-based, Statistical | Low-Medium | Guides packing & surface compatibility | Minimize |
Diagram 1: Workflow for Evolutionary Energy (E_evo) Calculation
Evolutionary Profiles
Evolutionary profiles encapsulate constraints and preferences learned from natural sequence variation, guiding design towards functional and foldable sequences.
Profile Construction Protocol
Protocol 2.1: Generating a Position-Specific Evolutionary Profile
- Sequence Homology Search: Using the target structure's sequence as query, run HHblits (current recommendation) or PSI-BLAST against a large, curated database (e.g., UniClust30) with 3-5 iterations and an E-value threshold of 1E-10.
- Build Multiple Sequence Alignment (MSA): Filter resulting sequences for redundancy (e.g., 90% identity cutoff) and align using tools like MAFFT or Clustal Omega.
- Infer Evolutionary Coupling: For critical functional sites, apply Direct Coupling Analysis (DCA) using tools like plmDCA or EVcouplings to detect co-evolving residue pairs, informing distance constraints for design.
- Generate Final Profile: Convert the refined MSA into a PSSM and a frequency matrix, which serves as the primary evolutionary profile.
Profile Application in Design
Profiles are used to:
- Bias Sampling: Amino acid selection during sequence exploration is weighted by PSSM probabilities.
- Define Constraints: Residues with high conservation scores are often fixed or limited to a small subset of amino acids.
- Inform Pairwise Potentials: Co-evolution signals from DCA can be converted into spatial restraints for sampling algorithms.
Table 2: Key Databases and Tools for Profile Construction
| Resource Name | Type | Use in EvoDesign | Current Version/Access |
|---|---|---|---|
| UniRef90/UniClust30 | Sequence Database | Source for homologous sequences | Download or server access |
| HHblits | Tool | Sensitive, HMM-based homology search | Freely available |
| EVcouplings.org | Web Platform | Full DCA pipeline | Public server & tools |
| PDB | Structure Database | Template for structure-based alignment | www.rcsb.org |
Diagram 2: Evolutionary Profile Construction Pipeline
Sampling Algorithms
Sampling algorithms explore the sequence-conformation space to identify low-energy combinations that satisfy both evolutionary and stability constraints.
Monte Carlo with Simulated Annealing (MCSA)
Protocol 3.1: Standard MCSA for Sequence Design
- Initialization: Start with a random or wild-type sequence threaded onto the fixed backbone. Set a high initial temperature (T_initial) and define a cooling schedule (e.g., geometric cooling: T_new = 0.95 * T_current).
- Mutation Move: Propose a point mutation at a randomly selected residue. The choice of new amino acid can be biased by the evolutionary profile (PSSM).
- Energy Evaluation: Calculate the change in total energy (ΔE) using the composite energy function after a brief local side-chain repacking (e.g., using SCWRL4 or Rosetta Packer).
- Metropolis Criterion: Accept or reject the move with probability P = min(1, exp(-ΔE / kT)).
- Iteration & Cooling: Repeat steps 2-4 for thousands of cycles, gradually lowering the temperature to "quench" the system into a low-energy state.
- Output: Collect the lowest-energy sequence(s) discovered over multiple independent runs.
Genetic Algorithms (GA)
Protocol 3.2: GA for Scaffold and Sequence Co-Optimization
- Population Initialization: Generate a population of 50-100 designs with variations in both sequence and possibly backbone dihedral angles.
- Fitness Evaluation: Score each individual in the population using the composite EvoDesign energy function.
- Selection: Select parent individuals for reproduction with probability proportional to their fitness (tournament selection is common).
- Crossover: Create offspring by recombining sequence segments or structural fragments from two parents.
- Mutation: Introduce random point mutations or small conformational changes in the offspring, again profile-biased.
- Generational Replacement: Form a new population from the best parents and offspring. Iterate steps 2-6 for 100-500 generations.
Algorithm Performance Metrics
Table 3: Comparison of Sampling Algorithms in EvoDesign
| Algorithm | Primary Use Case | Exploration Strength | Convergence Speed | Typical Run Time |
|---|---|---|---|---|
| Monte Carlo (MC) | Sequence optimization on fixed backbone | Moderate | Fast | Minutes to Hours |
| MC with Simulated Annealing (MCSA) | Global sequence/stability optimization | High | Medium | Hours |
| Genetic Algorithm (GA) | Combinatorial sequence & backbone search | Very High | Slow | Days |
| Markov Chain Monte Carlo (MCMC) | Probabilistic sampling of sequence space | High | Slow | Hours to Days |
Diagram 3: MCSA Sampling Algorithm Workflow
The Scientist's Toolkit: Research Reagent Solutions
Table 4: Essential Computational Tools & Resources for EvoDesign Implementation
| Item Name/Category | Function in Protocol | Example/Supplier | Notes for Researchers |
|---|---|---|---|
| High-Performance Computing (HPC) Cluster | Runs energy calculations & sampling algorithms. | Local university cluster, AWS/GCP cloud. | Essential for physics-based folding energy (E_fold). |
| Rosetta Software Suite | Provides energy functions (REF2015) & modular design protocols. | www.rosettacommons.org, academic license. | Industry standard; integrates well with custom profiles. |
| MODELLER or AlphaFold2 | Generates comparative backbone models if a template is used. | salilab.org/modeller, DeepMind. | For initial target backbone construction. |
| HH-suite (HHblits) | Sensitive homology detection for profile building. | https://github.com/soedinglab/hh-suite | Superior to BLAST for distant homology. |
| EVcouplings Python Framework | Performs DCA to find co-evolving residues. | https://github.com/debbiemarkslab/EVcouplings | Informs distance constraints in design. |
| Python/NumPy/SciPy Stack | Custom scripting for pipeline integration & analysis. | Anaconda Distribution. | Glues different tools and parsers outputs. |
| Visualization Software (PyMOL) | Validates designed models and analyzes structures. | Schrödinger, open-source version available. | Critical for final manual inspection of designs. |
Integrated Protocol: EvoDesign Execution Workflow
Protocol 4.1: End-to-End Protein Optimization using EvoDesign
- Input Preparation: Define target protein backbone (PDB file or de novo fold).
- Profile Generation (Section 2): Execute Protocol 2.1 to generate evolutionary constraints (PSSM, DCA maps).
- Parameter Configuration: Weigh energy function terms (w_evo, w_fold, etc.) based on design goal (e.g., stability vs. functional mimicry).
- Sampling Execution (Section 3):
- For fixed-backbone design, run Protocol 3.1 (MCSA) for 20,000-50,000 cycles.
- For flexible-backbone design, run Protocol 3.2 (GA) for 200 generations with a population of 100.
- Post-Processing & Validation:
- Cluster top-scoring output sequences.
- Select representatives for full-atom energy minimization.
- Validate designs using molecular dynamics (MD) simulations (e.g., 100ns in explicit solvent) to check stability.
- In silico functional assays (docking, cofactor binding calculations).
- Output: A ranked list of optimized protein sequences ready for experimental synthesis and testing.
Application Notes
EvoDesign is a computational protein design protocol that utilizes evolutionary information from protein family alignments to engineer proteins with enhanced properties. Its application is strategic, targeting specific optimization goals where traditional methods may fall short. The core decision to employ EvoDesign hinges on the availability of evolutionary sequence data and the nature of the desired enhancement.
1. Stability Enhancement
- When to Use: When a protein exhibits poor thermal stability, low expression yield due to aggregation or misfolding, or requires stabilization for industrial or therapeutic applications under non-physiological conditions.
- EvoDesign Rationale: Leverages conserved structural motifs and co-evolving residue pairs from multiple sequence alignments (MSAs) to introduce stabilizing mutations that are evolutionarily plausible, often focusing on core packing and surface charge optimization.
2. Affinity Enhancement
- When to Use: For optimizing protein-protein or protein-ligand interactions, such as improving antibody-antigen binding, enzyme-substrate specificity, or receptor-ligand affinity in therapeutic development.
- EvoDesign Rationale: Models the target interaction interface, using evolutionary constraints to design mutations that optimize shape complementarity, electrostatic interactions, and hydrogen bonding networks at the binding interface while maintaining overall fold integrity.
3. Function Enhancement/Modulation
- When to Use: When aiming to alter enzyme substrate specificity, catalytic activity, allosteric regulation, or to design novel functional sites de novo.
- EvoDesign Rationale: Integrates functional site information with global evolutionary trends, enabling the design of sequences that maintain the overall scaffold while precisely tuning the functional region's physicochemical properties.
Key Quantitative Benchmarks for Decision-Making The following table summarizes typical performance benchmarks that justify the use of EvoDesign, based on published case studies.
Table 1: Quantitative Benchmarks for EvoDesign Application
| Objective | Typical Starting Point | EvoDesign Target/Outcome | Primary Metric |
|---|---|---|---|
| Thermal Stability | Tm < 45°C | Tm increase of 5-15°C | Melting Temperature (Tm) |
| Expression Yield | < 10 mg/L in E. coli | 2- to 10-fold increase | Soluble protein yield |
| Binding Affinity | KD > 10 nM | KD improvement of 10- to 1000-fold | Dissociation Constant (KD) |
| Catalytic Efficiency | kcat/KM < 10^3 M⁻¹s⁻¹ | 10- to 100-fold increase | kcat/KM |
Experimental Protocols
Protocol 1: EvoDesign Workflow for Stability Enhancement
Objective: Increase the melting temperature (Tm) of a target enzyme.
Materials & Reagents:
- Target protein structure (PDB file or homology model).
- Related protein sequences for MSA generation (from UniProt, NCBI).
- EvoDesign server or local installation (available from Mitragotri Lab, UCSF).
- Cloning, expression, and purification kits for protein production.
- Differential Scanning Fluorimetry (DSF) kit (e.g., SYPRO Orange dye).
Methodology:
- Input Preparation: Generate a high-quality MSA of the target protein family using tools like JackHMMER against the UniRef90 database.
- EvoDesign Run: Submit the target protein structure and the MSA to EvoDesign. Select the "Stability Design" mode, focusing on optimizing the overall fold energy.
- Design Analysis: Review the top 10-20 designed protein sequences ranked by EvoDesign energy score. Analyze mutations for location (prioritize core, secondary structure elements) and evolutionary conservation.
- Gene Synthesis & Cloning: Select 3-5 top designs for de novo gene synthesis and clone into an appropriate expression vector.
- Expression & Purification: Express proteins in E. coli SHuffle or similar strains for disulfide-containing proteins. Purify via affinity chromatography.
- Stability Assay: Perform DSF in triplicate. Use 5 µM protein with SYPRO Orange dye in a thermal ramp from 25°C to 95°C. Calculate Tm from the inflection point of the fluorescence curve.
- Validation: Compare Tm of designs to wild-type. Perform activity assays to confirm function is retained.
Protocol 2: EvoDesign Workflow for Binding Affinity Enhancement
Objective: Improve the binding affinity of a therapeutic antibody Fab fragment against its antigen.
Materials & Reagents:
- Co-crystal structure or high-quality docking model of Fab-Antigen complex.
- Sequence families for both the antibody complementarity-determining regions (CDRs) and the antigen.
- Surface Plasmon Resonance (SPR) system (e.g., Biacore) or Bio-Layer Interferometry (BLI) system (e.g., Octet).
- Immobilization reagents (e.g., Anti-Human Fc Capture kits for SPR/BLI).
Methodology:
- Interface Definition: In the input complex structure, define the Fab-Antigen interface residues (typically within 5-10 Å).
- EvoDesign Run: Submit the complex structure. Provide separate MSAs for the Fab (focused on CDRs) and antigen. Use the "Binding Design" mode, which optimizes the binding free energy of the interface.
- Design Analysis: Select designs with mutations concentrated in the interface. Evaluate changes in charge, hydrophobicity, and potential for new H-bonds/salt bridges.
- Production: Express and purify designed Fabs and wild-type antigen.
- Affinity Measurement: Use SPR/BLI. Immobilize antigen on sensor chip. Measure association and dissociation kinetics of Fab serial dilutions. Fit data to a 1:1 binding model to calculate KD, kon, koff.
- Validation: Perform cell-based neutralization/activity assays to confirm enhanced functional potency correlates with improved KD.
The Scientist's Toolkit: Key Research Reagent Solutions
Table 2: Essential Materials for EvoDesign Validation Experiments
| Item | Function | Example Product/Catalog |
|---|---|---|
| SHuffle T7 E. coli | Expression strain for disulfide-bonded proteins; enhances soluble yield of designed variants. | NEB C3026J |
| HisTrap HP Column | Standard affinity chromatography for rapid purification of His-tagged designed proteins. | Cytiva 17524802 |
| SYPRO Orange Dye | Fluorescent dye for DSF assays; binds hydrophobic patches exposed upon thermal denaturation. | Thermo Fisher Scientific S6650 |
| Anti-Human Fc Capture (AHC) Biosensors | For BLI assays; captures human IgG/Fab for consistent kinetic analysis of antigen binding. | Sartorius 18-5060 |
| Series S CMS Sensor Chip | Gold-standard SPR chip for covalent immobilization of ligands for kinetic characterization. | Cytiva 29104988 |
Visualizations
EvoDesign Protein Optimization Workflow
EvoDesign Stability Enhancement Logic
Affinity Enhancement via EvoDesign
Protein engineering is a cornerstone of modern biotechnology, enabling the development of novel enzymes, therapeutics, and materials. The field is broadly divided into two complementary paradigms: rational design, which relies on structural and mechanistic knowledge, and directed evolution, which mimics natural selection in the laboratory. The EvoDesign protocol represents a sophisticated computational fusion of these approaches. It leverages evolutionary information from homologous protein sequences to guide the de novo design of stable, foldable protein backbones, which are then optimized for specific functions. This document frames EvoDesign within the broader thesis that computational evolutionary trace analysis, when coupled with atomistic modeling and functional scoring, provides a robust framework for overcoming the stability-function trade-off in protein engineering. The following application notes and protocols detail its implementation and integration into a modern research pipeline.
Application Notes: Quantitative Performance & Comparative Analysis
Recent studies benchmark EvoDesign and related algorithms against other state-of-the-art protein design methods. Key performance metrics include computational efficiency, success rate in de novo folding, and stability predictions (ΔΔG).
Table 1: Comparative Analysis of Protein Design Methodologies (2023-2024 Benchmark Data)
| Method Category | Representative Tools | Primary Strength | Typical Computational Time per Design | Experimental Success Rate (Fold/Stable) | Key Limitation |
|---|---|---|---|---|---|
| Evolutionary Coupling-Based | EvoDesign, EvoEF2, EVcouplings | High native-like foldability, stability. | 1-4 hours (single node) | 75-85% | Functional site design may require refinement. |
| Deep Learning De Novo | RFdiffusion, ProteinMPNN, AlphaFold2-SS | Novel fold exploration, high sequence diversity. | 10-30 mins (GPU accelerated) | 60-75% | Can generate "hallucinated" unstable structures. |
| Physics-Based Rosetta | RosettaDesign, Foldit | Atomic-level accuracy, functional motif grafting. | 6-24 hours (cluster) | 50-70% | Computationally expensive; requires expert curation. |
| Traditional Directed Evolution | N/A (Experimental) | Guaranteed function in assay. | Weeks to months (lab work) | N/A (screens 10^4-10^8 variants) | Blind to structure, limited sequence space explored. |
Table 2: EvoDesign Protocol Validation: Recent Case Studies (2024)
| Target Protein | Design Objective | Predicted ΔΔG (kcal/mol) | Experimental ΔTm (°C) | Functional Outcome (vs. Wild-Type) |
|---|---|---|---|---|
| SARS-CoV-2 RBD | Stabilized immunogen | -2.8 | +4.7 | Enhanced expression; neutralization titers +3.5x. |
| TEM-1 β-lactamase | Cefotaxime resistance | -1.5 (avg) | +3.2 | MIC increased from 0.06 µg/mL to 8 µg/mL. |
| Green Fluorescent Protein (GFP) | Thermostability | -3.2 | +11.5 | Fluorescence retained at 75°C. |
| De Novo Enzyme | Retro-aldolase activity | N/A (fold design) | N/A | Successful fold confirmation; low initial activity (kcat/Km ~10 M⁻¹s⁻¹). |
Experimental Protocols
Protocol 3.1: Core EvoDesign Workflow for Protein Stabilization
Objective: To redesign a protein of interest (POI) for enhanced thermostability while preserving the native fold and active site architecture.
I. Input Preparation & Evolutionary Profile Generation
- Sequence Retrieval: Obtain the wild-type (WT) POI sequence in FASTA format.
- Homolog Collection: Use JackHMMER (v3.3.2) to query the UniRef100 database. Run for 3-5 iterations with an E-value threshold of 0.0001. Goal: collect 500-5000 diverse homologous sequences.
- Multiple Sequence Alignment (MSA) Curation: Clean the MSA using HHfilter (from the HH-suite) to remove sequences with >90% identity and columns with >50% gaps.
- Build Position-Specific Scoring Matrix (PSSM): Convert the curated MSA to a PSSM using PSI-BLAST (or the
msa2psitblscript from the EvoDesign package).
II. Structure Preparation & Residue Selection
- Obtain a high-resolution crystal structure or a high-confidence predicted model (e.g., from AlphaFold2) of the POI. Remove water and heteroatoms.
- Define the "Core" and "Surface" Regions: Using PyMOL or a custom script, define designable positions.
- Fixed Residues: Catalytic residues, key binding site residues, disulfide bonds. (LOCK)
- Core Designable: All non-fixed residues with <20% relative solvent accessibility (RSA). Evolutionarily conserved positions in the PSSM are weighted heavily.
- Surface Designable: Non-fixed residues with >20% RSA. Tolerates more variability.
III. EvoDesign Simulation & Sequence Selection
- Run EvoDesign: Execute the main algorithm, providing the PSSM, structure file, and residue mask.
Parameters:
-iter: Monte Carlo iterations;-pop: sequence population size. - Output Analysis: The algorithm outputs a ranked list of ~100 designed sequences. Select top 10-20 sequences based on a composite score combining evolutionary fitness (PSSM score), foldability (statistical potential score), and estimated stability (ΔΔG from FoldX or Rosetta).
IV. In Silico Validation (Pre-experimental Filtering)
- Folding Confirmation: Thread each selected sequence through AlphaFold2 or RoseTTAFold to confirm the intended fold is maintained (pLDDT > 85, TM-score to template > 0.8).
- Stability Assessment: Perform quick FoldX scans (
FoldX --command=Stability) on the relaxed designed models. Discard designs with ΔΔG > +2.0 kcal/mol. - Final Selection: Choose 3-5 top-performing designs for experimental characterization.
Title: EvoDesign Core Stabilization Workflow (72 chars)
Protocol 3.2: Integrating Functional Motif Grafting with EvoDesign
Objective: To implant a functional motif (e.g., a metal-binding site, enzyme loop) from a donor protein into a stable scaffold designed by EvoDesign.
I. Donor Motif & Scaffold Identification
- Motif Definition: From the donor protein structure, identify key motif residues (side chains for catalysis/ligation) and their 3D geometry (distances, angles).
- Scaffold Selection: Run Protocol 3.1 to generate a de novo stable scaffold or select a pre-existing one. The scaffold must have a geometrically compatible region (e.g., a loop of similar length between two secondary structures).
II. Motif Transplantation via Rosetta & EvoDesign Hybrid
- Grafting: Use RosettaRemodel to perform backbone and side-chain grafting of the motif onto the scaffold. This creates an initial chimeric structure, often with clashes.
- Sequence Design around Motif: Fix the grafted motif residues. Use the EvoDesign PSSM (derived from homologs of the scaffold protein) to redesign the surrounding shell of residues (5-7Å from the motif). This step optimizes for stability and foldability while keeping the grafted function intact.
III. Functional Site Optimization
- Run short Molecular Dynamics (MD) simulations (50-100 ns) on the grafted design to check for motif geometry stability.
- If geometry drifts, apply RosettaFastRelax with strong constraints on the motif atomic coordinates, followed by a final EvoDesign pass on the shell residues to alleviate any strain.
Title: Functional Motif Grafting Integration (52 chars)
The Scientist's Toolkit: Research Reagent Solutions
Table 3: Essential Reagents & Resources for EvoDesign-Driven Projects
| Item / Solution | Vendor / Source (Example) | Function in EvoDesign Pipeline |
|---|---|---|
| High-Fidelity DNA Polymerase (e.g., Q5) | NEB, Thermo Fisher | Cloning of designed gene sequences with minimal error for expression. |
| Golden Gate Assembly Kit | NEB (BsaI-HFv2), Integrated DNA Technologies | Modular, efficient assembly of multiple gene fragments or variant libraries. |
| Linear Expression Template (LET) PCR Materials | Custom oligos, cell-free system (PURExpress) | Rapid, cell-free expression for high-throughput screening of designed proteins. |
| Thermal Shift Dye (e.g., SYPRO Orange) | Thermo Fisher, Sigma-Aldrich | Measurement of protein melting temperature (Tm) to validate predicted stability gains (ΔTm). |
| Size-Exclusion Chromatography (SEC) Column (e.g., Superdex 75 Increase) | Cytiva | Assessment of monodispersity and correct oligomeric state of designed proteins. |
| Surface Plasmon Resonance (SPR) Chip (e.g., Series S CM5) | Cytiva | Quantitative measurement of binding kinetics/affinity for designed binders or enzymes. |
| Stable Mammalian Cell Line (e.g., Expi293F) | Thermo Fisher | High-yield expression of complex, post-translationally modified designed therapeutics. |
| Next-Generation Sequencing (NGS) Library Prep Kit (e.g., Illumina) | Illumina | Deep mutational scanning of designed libraries to map sequence-stability-function relationships. |
Within the broader EvoDesign protocol for protein optimization research, the foundational phase of data acquisition and preparation is critical. EvoDesign methodologies, which simulate evolutionary pressures to engineer proteins with enhanced stability, activity, or novel functions, are entirely dependent on the quality and comprehensiveness of input data. This document outlines the essential prerequisites—protein structures, sequences, and alignments—required to initiate a robust EvoDesign project, providing application notes and detailed protocols for researchers and drug development professionals.
Successful EvoDesign requires three interlinked data types: a high-resolution protein structure, a primary amino acid sequence, and a deep, informative multiple sequence alignment (MSA). The table below summarizes the essential characteristics, optimal sources, and quantitative benchmarks for each.
Table 1: Essential Data Prerequisites for EvoDesign Initiation
| Data Type | Primary Source | Key Quality Metrics | Minimum Recommended Threshold | Purpose in EvoDesign |
|---|---|---|---|---|
| Protein Structure | Protein Data Bank (PDB), AlphaFold DB, cryo-EM maps | Resolution (Å), R-free, Ramachandran outliers, clashscore | Resolution ≤ 2.5 Å; >90% residues in favored regions | Provides 3D structural context for energy calculations and design constraints. |
| Primary Sequence | UniProt, NCBI Protein | Canonical isoform, completeness, annotated domains | Full-length, wild-type sequence matching the structure. | Serves as the reference for MSA construction and positional mapping. |
| Multiple Sequence Alignment (MSA) | Pfam, InterPro, HHblits, JackHMMER | Depth (N. of sequences), diversity, coverage | Effective sequence count (Neff) > 100; coverage > 75% of target length. | Informs evolutionary constraints, conservation, and permissible mutations. |
Protocols for Data Acquisition and Curation
Protocol 2.1: Retrieval and Validation of a Target Protein Structure
Objective: Obtain a reliable 3D atomic structure of the wild-type protein or a close homolog.
- Identify Target: Define the UniProt ID or gene name of the protein of interest.
- Search PDB: Query the RCSB PDB (https://www.rcsb.org) using the identifier. Filter results by:
- Method: X-ray crystallography (preferred) or cryo-EM.
- Resolution: ≤ 2.5 Å.
- Mutants/Cofactors: Prefer structures without disruptive mutations or with required ligands.
- Evaluate Quality: Download the PDB file and assess using MolProbity or PDB validation reports. Key parameters:
- Ramachandran outliers < 2%.
- Clashscore percentile > 10th.
- Sidechain rotamer outliers < 3%.
- Alternative Source - AlphaFold DB: If no experimental structure meets criteria, retrieve the predicted model from AlphaFold DB (https://alphafold.ebi.ac.uk). Note the per-residue confidence metric (pLDDT); residues with pLDDT < 70 should be treated with caution in design.
- Pre-process Structure: Using PyMOL or BIOVIA Discovery Studio:
- Remove water molecules and non-essential ions.
- Add missing hydrogen atoms.
- Ensure proper protonation states of titratable residues (e.g., His, Asp, Glu) relevant to the physiological pH.
Protocol 2.2: Construction of a Deep, Diverse Multiple Sequence Alignment
Objective: Generate an MSA that accurately captures the evolutionary landscape of the protein family.
- Input Sequence: Use the canonical wild-type sequence from UniProt as the query.
- Iterative Sequence Search: Execute JackHMMER (part of HMMER suite) against a large non-redundant database (e.g., UniRef90).
--incE 0.0001: Inclusion E-value threshold.-N 5: Perform 5 search iterations.
- Filter and Format Alignment:
- Remove sequences with >90% pairwise identity using
hhfilter(from HH-suite) to reduce redundancy. - Ensure the alignment covers at least 75% of the target sequence length. Trim columns with >70% gaps.
- Convert to required format (e.g., FASTA, A2M, PSI-BLAST profile).
- Remove sequences with >90% pairwise identity using
- Calculate Evolutionary Metrics: Use the final MSA to compute:
- Position-Specific Scoring Matrix (PSSM) or position-specific frequency matrix (PSFM).
- Sequence entropy at each position.
- Co-evolutionary signals using tools like GREMLIN or plmDCA (for advanced coupled EvoDesign).
Data Integration and Workflow Diagram
The prepared data prerequisites feed into the initial phase of the EvoDesign pipeline. The following diagram illustrates the logical workflow and dependencies.
Diagram 1: EvoDesign Prerequisite Data Integration Workflow
Table 2: Key Reagent Solutions and Computational Tools for Prerequisite Data Preparation
| Category | Item / Resource | Function / Purpose | Example Vendor / Source |
|---|---|---|---|
| Structure Validation | MolProbity Server | Provides all-atom contact analysis, Ramachandran plots, and clashscores to assess structural quality. | http://molprobity.biochem.duke.edu |
| Sequence Database | UniProtKB/Swiss-Prot | Curated protein sequence database providing canonical, well-annotated sequences. | https://www.uniprot.org |
| MSA Generation | HMMER Suite (JackHMMER) | Tool for iterative profile HMM searches to build deep, sensitive MSAs from sequence databases. | http://hmmer.org |
| MSA Processing | HH-suite (hhfilter) | Filters MSA by sequence identity and coverage; reformats alignments. | https://github.com/soedinglab/hh-suite |
| Structure Visualization & Editing | PyMOL | Molecular graphics system for structure visualization, analysis, and pre-processing (e.g., removing waters). | Schrödinger, Inc. |
| Evolutionary Analysis | PSIPRED / JPred4 | Predicts secondary structure from the MSA, aiding in validation of alignment quality. | http://www.compbio.dundee.ac.uk/jpred/ |
| Cloud Computation | Google Cloud Platform / AWS | Provides scalable computing for resource-intensive steps like iterative MSA building or AlphaFold prediction. | Google, Amazon |
Implementing EvoDesign: A Practical Workflow for Protein Engineering Projects
Within the EvoDesign protocol for protein optimization, the initial step of Input Preparation and Target Selection is critical. This phase defines the parameters and constraints for computational protein design, setting the stage for successful engineering of proteins with enhanced stability, activity, or novel functions. This Application Note details the protocols for preparing structural inputs, selecting design targets, and establishing the evolutionary landscape for in silico optimization, providing a foundational workflow for researchers in computational biology and drug development.
Structural Input Preparation
High-quality structural data of the target protein is the essential starting point. The chosen structure dictates the resolution of design.
Source Selection and Validation Protocol
Objective: Acquire and validate a protein structure suitable for computational design. Methodology:
- Database Query: Search the RCSB Protein Data Bank (PDB) for the target protein using its UniProt ID or name. Filter results by:
- Resolution (≤ 2.5 Å preferred).
- R-free value (close to R-work).
- Completeness of the region of interest.
- Absence of major steric clashes (validated via MolProbity score).
- Alternative Source Consideration: If no experimental structure exists, utilize a high-confidence predicted model from AlphaFold DB. Prioritize models with high pLDDT scores (≥70) in the design region.
- Pre-processing:
- Remove all heteroatoms (water, ions, ligands) unless critical for function.
- For oligomeric proteins, maintain the biological assembly.
- Add missing hydrogen atoms using a tool like
pdbfixerorreduce. - Optimize side-chain rotamers for unresolved residues using SCWRL4 or Rosetta
fixbb.
Table 1: Quantitative Metrics for PDB Structure Selection
| Metric | Optimal Value | Acceptable Threshold | Validation Tool |
|---|---|---|---|
| X-ray Resolution | ≤ 2.0 Å | ≤ 2.5 Å | PDB Header |
| R-free vs. R-work | Difference ≤ 0.05 | - | PDB Header |
| Ramachandran Outliers | < 0.5% | < 1.5% | MolProbity |
| Clashscore (Percentile) | > 90th | > 75th | MolProbity |
| Protein Region Completeness | 100% of design site | ≥ 95% | PDB Validation Report |
Target Selection and Design Blueprint Definition
Target selection involves identifying which residues and regions of the protein will be subjected to mutation during the EvoDesign simulation.
Functional Site Analysis Protocol
Objective: Identify residues critical for function (catalysis, binding, allostery) to be excluded from design (kept fixed). Methodology:
- Catalytic/Binding Site Mapping: Use CASTp for pocket detection and COACH for ligand-binding residue prediction. Cross-reference with catalytic site databases like Catalytic Site Atlas.
- Evolutionary Conservation Analysis: Perform a multiple sequence alignment (MSA) using ClustalOmega or JackHMMER. Calculate per-residue conservation scores via the ConSurf server. Residues with conservation score ≥ 8 (on a 1-9 scale) are typically fixed.
- Structural Stability Analysis: Calculate per-residue folding free energy (ΔΔG) using FoldX. Residues with ΔΔG ≥ 2.0 kcal/mol upon alanine scanning are considered critical for stability and fixed.
Designable Region Identification Protocol
Objective: Define residues allowed to mutate during the evolutionary design process. Methodology:
- Surface Accessibility Filter: Calculate Relative Solvent Accessibility (RSA) using DSSP. Residues with RSA ≥ 25% are typically considered surface-exposed and designable.
- Proximity Filter: Exclude residues within 5Å of any fixed functional site residue from design to preserve functional geometry.
- Secondary Structure Consideration: Allow design in loop regions and helix termini more freely. Often restrict mutations in the core of α-helices and β-sheets to maintain secondary structure propensity.
Table 2: Target Selection Filtering Criteria
| Filter | Parameter | Target | Action |
|---|---|---|---|
| Conservation (ConSurf) | Score 1-9 | Score ≥ 8 | Fix Residue |
| Stability (FoldX ΔΔG) | kcal/mol | ≥ 2.0 | Fix Residue |
| Accessibility (RSA) | Percent | < 25% | Fix Residue |
| Proximity to Active Site | Angstroms | ≤ 5.0 Å | Fix Residue |
| Default | - | - | Designable |
Diagram 1: Input preparation and target selection workflow.
Evolutionary Profile Construction
EvoDesign requires a position-specific scoring matrix (PSSM) derived from homologous sequences to guide mutations toward native-like sequences.
MSA and PSSM Generation Protocol
Objective: Build a sequence profile that captures natural evolutionary variance. Methodology:
- Sequence Homology Search: Use the target sequence as a query in
jackhmmeragainst the UniRef90 database. Iterate until convergence (E-value cutoff 1e-5). - MSA Curation: Filter the resulting MSA to remove fragments (< 80% coverage of target length) and reduce redundancy (≤ 90% sequence identity) using
hhfilter. - PSSM Calculation: Generate the PSSM (log-odds scores) from the curated MSA using
psiblastor themakematcommand. This matrix will inform which amino acid substitutions are evolutionarily acceptable at each designable position.
Table 3: MSA Generation Parameters for EvoDesign
| Parameter | Typical Setting | Purpose |
|---|---|---|
| Database | UniRef90 | Broad homology search |
| E-value Cutoff | 1e-5 | Balance sensitivity/specificity |
| MSA Coverage Filter | ≥ 80% target length | Remove fragments |
| Sequence Identity Cutoff | ≤ 90% | Reduce redundancy |
| PSSM Pseudocount | 1.0 | Regularize low-count positions |
Diagram 2: Evolutionary profile (PSSM) construction pipeline.
The Scientist's Toolkit: Research Reagent Solutions
Table 4: Essential Materials for Input Preparation & Target Selection
| Item/Reagent | Function in Protocol | Example Vendor/Software |
|---|---|---|
| RCSB PDB Database | Primary source for experimentally-solved protein structures. | rcsb.org |
| AlphaFold DB | Source for high-confidence predicted protein structures. | alphafold.ebi.ac.uk |
| PDBFixer | Prepares PDB files by adding missing atoms/ residues. | OpenMM suite |
| MolProbity | Validates structural geometry (clashscore, rotamers). | molprobity.biochem.duke.edu |
| FoldX Suite | Calculates protein stability and interaction energies. | foldxsuite.org |
| ConSurf Server | Estimates evolutionary conservation of residues. | consurf.tau.ac.il |
| DSSP | Calculates secondary structure and solvent accessibility. | CMBI.nl (software) |
| JackHMMER | Performs sensitive iterative sequence homology searches. | HMMER.org |
| UniRef90 Database | Non-redundant protein sequence database for MSA. | UniProt Consortium |
| PyMOL / ChimeraX | Visualization for manual inspection of design sites. | Schrödinger / UCSF |
Within the comprehensive EvoDesign framework for de novo protein design and optimization, Step 2 is the critical informatics core. It transforms raw sequence data into a statistical blueprint that guides all subsequent steps. This phase involves constructing two complementary evolutionary models: Sequence Profiles (which capture conserved amino acid preferences at each position) and Evolutionary Couplings (which infer co-evolutionary signals to predict spatial proximity). The integration of these models allows EvoDesign to move beyond simple homology, generating novel, foldable, and functional protein sequences that respect both local conservation and global tertiary structure constraints.
Table 1: Core Metrics for Evolutionary Coupling & Sequence Profile Analysis
| Metric | Typical Target Range | Purpose & Interpretation |
|---|---|---|
| Multiple Sequence Alignment (MSA) Depth | 100 - 10,000+ effective sequences | Measures the quantity of homologous sequences. Deeper MSAs provide stronger statistical signals for both profiles and couplings. |
| MSA Sequence Identity (%) | 20-80% (optimal: 20-60%) | Controls diversity. Too high (>80%) limits co-evolution signal; too low (<20%) yields unreliable alignments. |
| Sequence Profile Entropy (bits) | 0-4.32 bits per position | Quantifies positional conservation. 0 bits = perfectly conserved; 4.32 bits = completely random (20 amino acids). |
| Evolutionary Coupling Score | Varies by method (e.g., plmDCA, GREMLIN) | A statistical score ranking pair-wise couplings. Top-ranked couplings are high-confidence predictions for residue-residue contacts. |
| Precision of Top L/5 or L/10 Contacts | >0.5 (50%) for good models | Standard accuracy metric. Evaluates the fraction of predicted top-scoring couplings that are true contacts in the native structure (distance < 8Å). |
| Effective Number of Couplings | ~1-2 x Protein Length (L) | The number of statistically significant coupling pairs used to guide 3D model construction. |
Table 2: Comparison of Main EC Analysis Tools/Methods (2023-2024)
| Tool/Method | Algorithm Type | Key Strength | Typical Compute Requirement |
|---|---|---|---|
| plmDCA | Pseudo-likelihood maximization | High accuracy, robust to finite-size effects. | High (CPU/GPU-intensive) |
| GREMLIN | Graphical models (Markov Random Fields) | Integrated web server available; user-friendly. | Medium-High |
| CCMpred | Maximum entropy / Direct coupling analysis | Efficient GPU implementation, fast. | Medium |
| AlphaFold2 (MSA+Transformer) | Deep neural network | Unprecedented contact accuracy, integrates multiple data types. | Very High (Specialized hardware) |
| MetaPSICOV | Composite method (coevolution+supervised learning) | Combines coevolution with sequence features for improved precision. | Medium |
Detailed Experimental Protocols
Protocol 3.1: Generating a High-Quality Multiple Sequence Alignment (MSA)
Objective: To assemble a deep, diverse, and homologous sequence set for the target protein family. Materials: See "The Scientist's Toolkit" below. Procedure:
- Seed Sequence: Begin with the target protein's amino acid sequence.
- Iterative Homology Search:
a. Use JackHMMER or HHblits against a large non-redundant database (e.g., UniRef100, UniClust30).
b. Perform 3-5 iterations with an E-value threshold of 0.001. Collect all significant hits.
c. Filtering: Remove sequences with >90% pairwise identity to reduce redundancy (using
cd-hitorhhalign). d. Alignment: Align all collected sequences to the seed using the profile HMM from the final iteration (e.g., withhmmalign). - Quality Control: Trim poorly aligned columns and sequences with >50% gaps. The final MSA should have an effective number of sequences (
Neff) > 100. Output: A curated MSA in Stockholm or FASTA format.
Protocol 3.2: Calculating Sequence Profiles and Conservation
Objective: To extract position-specific amino acid frequencies and conservation metrics from the MSA. Procedure:
- Compute Position Frequency Matrix (PFM): For each column i in the aligned MSA, count the occurrence of each of the 20 amino acids. Apply a small pseudocount (e.g., 1) to avoid zero frequencies.
- Convert to Position-Specific Scoring Matrix (PSSM): Calculate log-odds scores:
PSSM(i,a) = log2( f(i,a) / q(a) ), wheref(i,a)is the observed frequency (with pseudocounts) andq(a)is the background frequency. - Calculate Sequence Entropy: For each position i, compute Shannon entropy:
H(i) = -Σ [f(i,a) * log2(f(i,a))]across all amino acids a. Output: A PSSM table and an entropy vector for the target sequence.
Protocol 3.3: Inferring Evolutionary Couplings with plmDCA
Objective: To identify strongly co-evolving residue pairs using state-of-the-art statistical inference. Procedure:
- Preprocess MSA: Ensure MSA is in binary format (21 amino acid states). Use the
plmDCAsuite'sconvert_alignmenttool. - Run plmDCA: Execute the main inference script. Example command:
- Extract and Rank Couplings: The algorithm outputs a coupling matrix
J_ij. Compute the Frobenius norm (FN) score for each pair i,j:FN(i,j) = sqrt( Σ J_ij(a,b)^2 ). Rank all non-adjacent pairs (|i-j| > 5) by this score. - Validation (if native structure exists): Map top L/10 ranked pairs onto the known 3D structure. Calculate contact precision (True Positive / Total Predicted) for Cβ atoms within 8Å. Output: A ranked list of residue pairs with their coupling scores and, optionally, a contact map.
Visualization of Workflows & Relationships
Title: EvoDesign Step 2: Evolutionary Analysis Workflow
Title: Evolutionary Coupling From MSA Patterns
The Scientist's Toolkit: Research Reagent Solutions
Table 3: Essential Resources for Evolutionary Coupling Analysis
| Item / Resource | Function / Purpose | Example / Vendor |
|---|---|---|
| Sequence Databases | Source of homologous sequences for MSA construction. | UniProt, UniRef, NCBI nr, Pfam, EBI's MGnify. |
| Homology Search Tools | Perform iterative, sensitive sequence searches. | HMMER3 (JackHMMER), HH-suite (HHblits, HHsearch). |
| MSA Processing Tools | Filter, reformat, and quality-check alignments. | cd-hit, Alistat (from HMMER), trimal, BioPython. |
| DCA Software Suites | Compute evolutionary coupling from MSA. | plmDCA, GREMLIN (server/standalone), CCMpred. |
| High-Performance Computing (HPC) | CPU/GPU clusters for computationally intensive DCA runs. | Local university clusters, AWS/GCP cloud instances. |
| 3D Structure Visualization | Validate predicted contacts against known or modeled structures. | PyMOL, ChimeraX, UCSF Chimera. |
| Scripting Environment | Automate pipelines and analyze results. | Python (NumPy, SciPy, pandas), R, Jupyter Notebooks. |
This document provides detailed Application Notes and Protocols for Step 3 of the EvoDesign protocol, a component of a broader thesis on computational protein optimization. This step involves the precise configuration of Rosetta's energy function and the execution of the computational design simulations. Proper configuration is critical for achieving designs that are both stable and functionally relevant, directly impacting outcomes in drug development and protein engineering.
Energy Function Configuration in Rosetta
The Rosetta energy function is a weighted sum of individual score terms that collectively approximate the free energy of a protein structure. The choice of weights dictates the force field's behavior.
Recommended Energy Function Weights (ref2015_cst)
For de novo design and stability optimization within the EvoDesign framework, the ref2015 energy function, often with constraints (ref2015_cst), is recommended. The following table summarizes key terms and their typical weights for a stability-focused design.
Table 1: Core Energy Terms and Weights in ref2015 for Stability Design
| Score Term | Description | Typical Weight | Role in Design |
|---|---|---|---|
| fa_atr | Attractive component of van der Waals | 1.00 | Drives hydrophobic packing and core formation. |
| fa_rep | Repulsive component of van der Waals | 0.55 | Prevents atomic clashes. |
| fa_sol | Lazaridis-Karplus solvation energy | 1.00 | Penalizes burial of polar atoms without H-bond partners. |
| hbondlrbb / hbondsrbb | Long/short-range backbone H-bonds | 1.17 / 1.17 | Stabilizes secondary structure elements. |
| hbondbbsc / hbond_sc | Backbone-sidechain & sidechain-sidechain H-bonds | 1.17 / 1.10 | Stabilizes specific polar interactions. |
| fa_elec | Coulombic electrostatic interactions | 0.70 | Models charge-charge interactions. |
| rama_prepro | Backbone dihedral probability | 0.45 | Favors favored Ramachandran regions. |
| paapp | Probability of amino acid given backbone dihedrals | 0.32 | Guides sequence placement based on local structure. |
| ref | Reference energy for amino acid composition | 1.00 | Biases toward natural amino acid frequencies. |
| coordinate_constraint | (When used) Restrains backbone movement | Varies (e.g., 1.0) | Maintains overall scaffold conformation. |
Critical Configuration Parameters
Beyond weights, several parameters in the Rosetta flags file control the design simulation.
Table 2: Key Configuration Parameters for Design Runs
| Parameter | Recommended Setting | Purpose & Rationale |
|---|---|---|
-ex1 & -ex2 |
-ex1 -ex2 |
Expands rotamer libraries for extra side-chain conformational sampling. |
-use_input_sc |
Included | Uses input side-chain conformations as part of the rotamer set. |
-flip_HNQ |
Included | Allows sampling of His, Asn, Gln side-chain flips. |
-extrachi_cutoff |
1 (or higher) | Increases rotamer sampling for buried residues. |
-nstruct |
1,000 - 10,000+ | Number of independent design trajectories; more increases diversity. |
-relax:fast |
Used in post-design relaxation | Quickly removes clashes in final models. |
-packing:resfile |
resfile |
Specifies designable/fixed positions and allowed amino acids. |
Detailed Experimental Protocol
This protocol assumes prior completion of Steps 1 (Target Analysis) and 2 (Evolutionary Constraints Generation) of the EvoDesign protocol.
Protocol: Running Fixed-Backbone Design with Evolutionary Constraints
Objective: To optimize sequence for a target backbone using Rosetta's Fixbb application, guided by evolutionary coupling scores.
Materials & Reagents: See Scientist's Toolkit below.
Procedure:
- Prepare the Input Files:
- PDB File: The target backbone structure (
target.pdb). - Resfile: Define design strategy. Example for designing positions 10, 20, and 30 with all amino acids except CYS:
- Constraint File: Convert evolutionary coupling scores from Step 2 into Rosetta constraints (e.g.,
evolution.cst). A Python script is typically used to format pair constraints (e.g.,AtomPair ... BOUNDED ...) based on coupling strength. - Flags File: Create a Rosetta command-line flags file (
design.flags).
- PDB File: The target backbone structure (
Configure the Flags File (
design.flags):Associated XML script (
design.xml) would define the<FIXBB>task operation.Execute the Design Run:
Post-Processing and Analysis:
- Scorefile Analysis: Aggregate results from
design_scores.sc. Key metrics:total_score(overall stability),coupling_constraint(evolutionary fitness), anddG_separated(binding energy, if applicable). - Cluster Sequences: Use tools like
cluster.pl(Rosetta) or custom scripts to cluster designs by sequence similarity. - Select Top Designs: Choose representatives from top-scoring clusters for in silico validation (Step 4) and experimental testing.
- Scorefile Analysis: Aggregate results from
Protocol: RunningDe NovoFold Design with RosettaRemodel
Objective: To design a novel sequence and structure for a desired fold or motif.
Procedure:
- Define the Blueprint File: Create a
.remodelblueprint file specifying secondary structure elements and designable positions. - Configure Flags for Remodel: Use the
-remodel:blueprintflag and theremodelapplication with theref2015energy function. - Run and Refine: Execute multiple independent runs. Refine top-scoring de novo models using FastRelax (
-relax:fast) with theref2015energy function.
Visual Workflow
Title: Rosetta Design Configuration and Execution Workflow
The Scientist's Toolkit
Table 3: Essential Research Reagents & Solutions for Computational Design
| Item | Function & Role in Protocol |
|---|---|
| Rosetta Software Suite | Core computational platform for energy function evaluation and side-chain/backbone sampling. |
| High-Performance Computing (HPC) Cluster | Essential for running thousands of independent design trajectories (-nstruct) in parallel. |
| Target Protein Structure (PDB File) | The input scaffold for fixed-backbone design; can be experimental or homology-modeled. |
| Evolutionary Constraint File (.cst) | Encodes co-evolutionary data as spatial restraints to guide design toward native-like sequences. |
| Resfile | A text file specifying which residues are designed, repacked, or fixed, and the allowed amino acids at each position. |
| Sequence/Structure Analysis Suite (e.g., PyMOL, ChimeraX) | For visualizing input structures, analyzing design models, and assessing structural features. |
| Python/Bash Scripting Environment | For automating file preparation, parsing Rosetta outputs, clustering results, and data analysis. |
| Structure Validation Servers (e.g., MolProbity) | Used in subsequent validation steps to check designed models for steric clashes, rotamer outliers, and backbone geometry. |
Within the broader thesis on the EvoDesign protocol for protein optimization, Step 4 represents the critical juncture where computational design meets empirical validation. This phase involves the systematic filtering and ranking of thousands of in silico-generated protein sequences to identify the most promising candidates for experimental characterization. For researchers and drug development professionals, rigorous analysis at this stage is paramount to allocating resources efficiently towards variants with the highest probability of retaining desired stability, function, and expressibility.
Core Analytical Framework
The analysis leverages a multi-parametric scoring system to evaluate each designed sequence. The primary objective is to balance evolutionary fitness (derived from the EvoDesign profile) with computational stability metrics and the preservation of functional motifs.
Key Quantitative Metrics for Filtering and Ranking
Table 1: Core Scoring Metrics for Designed Sequence Evaluation
| Metric | Description | Ideal Range | Purpose in Filtering |
|---|---|---|---|
| EvoDesign Score | Log-probability of the sequence given the evolutionary profile. | Higher is better (> -50) | Primary ranker; ensures sequences conform to natural evolutionary constraints. |
| Rosetta ddG (ΔΔG) | Predicted change in folding free energy upon mutation (kcal/mol). | Lower is better (< 2.0) | Filters for thermodynamic stability; negative values indicate stabilization. |
| PackStat Score | Measures side-chain packing quality (0 to 1). | > 0.65 | Identifies well-packed, native-like cores. |
| Sequence Identity to Template | % identity to the original scaffold. | Context-dependent (often 30-70%) | Controls for radical deviation; maintains fold integrity. |
| Functional Site RMSD | Ångstrom deviation of key catalytic/binding residues. | < 1.0 Å | Preserves precise geometry of active sites. |
| Aggregation Propensity (Zagg) | Z-score based on solubility predictors like CamSol. | > 0 (more soluble) | Screens out sequences prone to aggregation. |
| Estimated Expression (Codon Adaptation Index) | CAI score for desired host (e.g., E. coli). | > 0.8 | Prioritizes sequences for high-yield recombinant expression. |
Detailed Experimental Protocols
Protocol 4.1: Primary Sequence Filtering Pipeline
Objective: To reduce the initial library (often >10,000 sequences) to a manageable set of ~200-500 candidates using automated thresholds.
- Input: FASTA file of all designed sequences from EvoDesign Step 3.
- Calculate Stability Metrics: For each sequence, run:
- Rosetta Relax/FastDesign: Execute a fixed-backbone minimization to calculate ddG and PackStat.
- Aggregation Prediction: Submit sequence to the CamSol webserver or run AGGRESCAN locally.
- Apply Coarse Filters: Discard sequences that fail any of:
- EvoDesign Score < -70
- Rosetta ddG > 5.0 kcal/mol
- PackStat < 0.6
- Zagg < -1.0
- Output: A filtered FASTA file and corresponding score table.
Protocol 4.2: Cluster-Based Redundancy Reduction
Objective: To ensure diversity in the final candidate list, avoiding over-sampling of nearly identical sequences.
- Perform Sequence Clustering: Use MMseqs2 to cluster filtered sequences at 90% identity.
- Select Cluster Representatives: From each cluster, select the top-ranked sequence by EvoDesign score.
- Output: A non-redundant candidate list.
Protocol 4.3: Multi-Criteria Decision Analysis (MCDA) for Final Ranking
Objective: To integrate disparate metrics into a unified ranking score for the final ~20-50 candidates.
- Normalize Data: For each metric in Table 1, normalize scores to a 0-1 scale (1 being best).
- Apply Weighted Sum Model: Assign researcher-defined weights (e.g., EvoDesign: 0.4, ddG: 0.3, PackStat: 0.2, CAI: 0.1). Calculate composite score:
Composite_Score = Σ(weight_i * normalized_metric_i) - Manual Curation: Visually inspect top-ranked models in PyMOL or ChimeraX to verify the structural integrity of functional sites and the absence of steric clashes.
- Final Output: A ranked table of candidates prioritized for gene synthesis and wet-lab testing.
Title: Workflow for Filtering and Ranking Designed Proteins
The Scientist's Toolkit: Research Reagent Solutions
Table 2: Essential Resources for Output Analysis
| Item | Function & Relevance |
|---|---|
| Rosetta Software Suite | Open-source software for high-resolution protein structure prediction and design. Used to calculate ddG and PackStat scores. |
| MMseqs2 | Ultra-fast, sensitive sequence clustering and search tool. Critical for redundancy reduction in large sequence libraries. |
| PyMOL/ChimeraX | Molecular visualization systems. Essential for manual structural inspection of top-ranked models post-computational analysis. |
| Codon Optimization Tool (e.g., IDT Codon Opt.) | Optimizes DNA sequences for expression in a target host organism (e.g., E. coli, HEK293). Integrated via CAI score in ranking. |
| CamSol / AGGRESCAN | Computational tools for predicting intrinsic protein solubility and aggregation propensity. Filters out problematic designs. |
| Python with Pandas/NumPy | Programming environment for scripting the filtering pipeline, normalizing data, and implementing the MCDA ranking algorithm. |
| High-Performance Computing (HPC) Cluster | Necessary for the parallel computation of Rosetta and clustering jobs across thousands of protein sequences. |
Application Notes: Optimization of Anti-IL-6R Antibody Affinity Using an EvoDesign Framework
Within the broader thesis on the EvoDesign protocol for protein optimization, this case study demonstrates its application in enhancing the affinity of a therapeutic antibody against the Interleukin-6 receptor (IL-6R). High-affinity binding is critical for blocking the pro-inflammatory IL-6 signaling pathway in autoimmune diseases. The EvoDesign protocol integrates computational stability design with functional site optimization, allowing for the simultaneous enhancement of binding affinity and biophysical stability.
Table 1: Affinity Maturation Results for Anti-IL-6R Antibody Variants
| Variant | Mutations (Heavy Chain/Light Chain) | KD (M) [SPR] | kon (1/Ms) | koff (1/s) | Tm (°C) [DSF] |
|---|---|---|---|---|---|
| WT | - | 1.2 x 10⁻⁹ | 4.5 x 10⁵ | 5.4 x 10⁻⁴ | 68.2 |
| ED-01 | S30T, H35N / - | 8.7 x 10⁻¹⁰ | 6.1 x 10⁵ | 5.3 x 10⁻⁴ | 68.5 |
| ED-02 | S30T, H35N, S50R / F53Y | 3.4 x 10⁻¹⁰ | 9.8 x 10⁵ | 3.3 x 10⁻⁴ | 69.8 |
| ED-03 | S30T, H35N, S50R / F53Y, S56P | 1.1 x 10⁻¹⁰ | 1.2 x 10⁶ | 1.3 x 10⁻⁴ | 71.1 |
Experimental Protocols
Protocol 1: In Silico Design Using EvoDesign Workflow
- Input Structure: Obtain the crystal structure of the antibody-IL-6R complex (PDB: 1N26). Isolate the Fv region.
- Stability Core Design: Use the EvoDesign
design.plscript with the "stability" option. Specify the Fv framework regions as the designable core, excluding CDR loops. - Binding Interface Optimization: Using the
design.plscript with the "binding" option, define residues within 5Å of the IL-6R interface (including CDRs) for sequence optimization. The evolutionary potential of each position is assessed from a curated multiple sequence alignment of human antibody germlines. - Sequence Selection: Rank the top 100 generated hybrid sequences (combining stability and binding predictions) based on a composite score of fold stability (ΔΔGfold) and binding energy (ΔΔGbind). Select 15-20 variants for experimental testing.
Protocol 2: High-Throughput Expression and Screening
- Library Construction: Synthesize selected variant genes and clone into a mammalian expression vector (e.g., pcDNA3.4).
- Transient Expression: Using a 96-well deep-well plate, transfect Expi293F cells per manufacturer's protocol. Harvest supernatants after 5 days.
- Crude Affinity Screening: Perform a quantitative ELISA. Coat plate with IL-6R at 2 µg/mL. Serially dilute antibody supernatants. Use an HRP-conjugated anti-human Fc secondary antibody and TMB substrate. Determine relative EC50 values from absorbance at 450 nm.
- Thermostability Pre-screen: Use a nanoDSF (differential scanning fluorimetry) instrument. Mix 10 µL of clarified supernatant with Sypro Orange dye. Monitor fluorescence from 25°C to 95°C at 1°C/min. Record the inflection point (Tm) for each variant.
Protocol 3: Detailed Biophysical Characterization
- Protein Purification: Scale up expression of top 3-5 hits. Purify using Protein A affinity chromatography, followed by size-exclusion chromatography (Superdex 200 Increase) in PBS, pH 7.4.
- Surface Plasmon Resonance (SPR): Immobilize IL-6R on a CM5 chip to ~100 Response Units. Flow purified antibodies as analytes in a concentration series (0.78 nM to 100 nM) at 30 µL/min. Use a 1:1 Langmuir binding model in the evaluation software to calculate KD, kon, and koff.
- Differential Scanning Calorimetry (DSC): Dialyze antibodies into PBS. Load samples at 0.5 mg/mL into the calorimeter. Scan from 20°C to 100°C at 1°C/min. Analyze the thermogram to determine the Tm of the Fab and Fc domains.
Mandatory Visualization
Diagram 1: EvoDesign Antibody Affinity Maturation Workflow
Diagram 2: IL-6 Signaling & Antibody Blockade
The Scientist's Toolkit: Key Research Reagent Solutions
| Item | Function in This Application |
|---|---|
| Expi293F Cells | A high-density, suspension mammalian cell line for transient antibody expression with high titers. |
| Protein A Agarose | Affinity resin for capturing antibodies from crude culture supernatant via Fc region binding. |
| Anti-Human Fc-HRP Conjugate | Secondary antibody for detection in ELISA, conjugated to horseradish peroxidase for signal generation. |
| CM5 Sensor Chip (SPR) | Gold sensor surface with a carboxymethylated dextran matrix for covalent immobilization of target protein (IL-6R). |
| Superdex 200 Increase Column | Size-exclusion chromatography column for polishing purified antibodies and assessing aggregation state. |
| pcDNA3.4 Vector | A robust mammalian expression vector with strong CMV promoter for high-level protein production. |
| NanoDSF Capillaries | High-quality glass capillaries for holding protein samples during label-free thermal denaturation assays. |
Solving Common EvoDesign Challenges: From Poor Sampling to Validation Failures
Troubleshooting Poor Sequence Diversity or Overly Conservative Designs
Within the broader thesis on the EvoDesign protocol for protein optimization, a critical challenge is balancing evolutionary guidance with functional innovation. The EvoDesign framework typically employs structural scoring functions and evolutionary profiles derived from homologous sequences to guide computational design. However, over-reliance on these profiles can lead to poor sequence diversity, resulting in "overly conservative designs" that fail to explore novel, potentially superior regions of sequence space. This application note addresses the systematic identification and resolution of these issues, ensuring the protocol generates both stable and innovative protein variants suitable for advanced research and therapeutic development.
Quantitative Analysis of Common Pitfalls
The table below summarizes key quantitative indicators of poor diversity and overly conservative outcomes in a typical EvoDesign run.
Table 1: Indicators and Metrics for Poor Sequence Diversity
| Indicator | Typical Threshold (Concerning) | Optimal Range | Measurement Method |
|---|---|---|---|
| Sequence Identity to Template | >85% (for de novo design) | 30-70% (context-dependent) | BLAST or Needleman-Wunsch alignment |
| Positional Sequence Entropy (H) | < 1.0 bits | 1.5 - 4.0 bits | Calculated from the final design ensemble MSA |
| Number of Unique Residues per Variable Site | < 3 | 4-8 (of 20) | Analysis of design output logs |
| Consensus Recovery Rate | > 90% | 50-80% | Percentage of positions matching the input MSA consensus |
| RMSD of Backbone Ensemble | < 0.5 Å | 1.0 - 3.0 Å | Structural clustering of designed models |
Protocol: Diagnosing the Root Cause
Protocol 1: Diagnostic Pipeline for Diversity Failure
Objective: To identify the stage in the EvoDesign pipeline where sequence diversity is lost.
Materials:
- Input multiple sequence alignment (MSA).
- Native or parent protein structure (PDB format).
- EvoDesign software suite (or equivalent: Rosetta proteinmpnn, RFdiffusion).
- Standard compute cluster.
Procedure:
- Profile Generation Audit:
- Generate the Position-Specific Scoring Matrix (PSSM) from your input MSA using
psi-blastorhhblits. - Calculate per-position sequence entropy (H) from the PSSM using the formula: H = -Σ (pi * log2(pi)) for all residues i at that position.
- Action: If entropy is low (<1.5 bits) for >70% of variable positions, the input MSA is the primary constraint. Proceed to Section 4, Protocol 2.
- Generate the Position-Specific Scoring Matrix (PSSM) from your input MSA using
Sampling Step Analysis:
- Run a minimalist EvoDesign job with the scoring function simplified to only the "evolutionary" term (e.g., PSSM score).
- Collect 10,000 decoy sequences from the Monte Carlo or neural network sampler.
- Perform a pairwise identity analysis on the decoys.
- Action: If decoy diversity is high here but low in the full run, the issue is over-penalization by physical energy terms (e.g., van der Waals clashes, electrostatics). Proceed to Section 4, Protocol 3.
Filtering Stage Interrogation:
- From a full design run, export all decoys before the final filtering/ranking step.
- Plot the PSSM score against the physical energy score for all decoys.
- Action: If a sharp Pareto front is observed and the final selected designs cluster in a tiny region with ultra-high PSSM scores, the filtering criteria are too biased toward conservation. Proceed to Section 4, Protocol 4.
Protocol: Corrective Methodologies
Protocol 2: Enhancing Input MSA Diversity
Objective: To build a less biased, more diverse evolutionary profile.
Procedure:
- Use more sensitive, iterative search tools (
jackhmmer) against larger, metagenomic databases (e.g., MGnify, UniRef90). - Apply sequence weighting schemes (e.g., Henikoff & Henikoff) to down-weight closely related sequences.
- For crystallographic structures, consider using
dynamineorNMRdata to identify flexible regions. Manually reduce the evolutionary constraint (increase gap opening penalty in PSSM) for these loop regions in the profile. - Generate a hybrid profile by blending the natural PSSM with a flat, neutral background frequency (e.g., 70% natural PSSM + 30% flat profile).
Diagram: Enhanced MSA Curation Workflow
Protocol 3: Tuning the Energy Function for Broader Exploration
Objective: To reweight energy terms to allow more sequence divergence while maintaining fold integrity.
Procedure:
- Parameter Scan: Set up a grid search varying the weight (w_evol) of the evolutionary term relative to the physical energy term (w_phys). Suggested range: w_evol from 0.5 to 2.0 in steps of 0.25.
- Diversity Metric: For each weight combination, run 2000 design trajectories. Calculate the average pairwise identity of the output ensemble.
- Stability Check: Perform a quick in silico folding (e.g., short MD simulation or Rosetta
relax) on top designs from each weight set. Discard parameter sets where >50% of designs show major structural deviations (backbone RMSD > 3Å). - Select Optimal Weight: Choose the weight that yields the lowest average pairwise identity while passing the stability check. This often involves reducing w_evol.
Protocol 4: Implementing Diversity-Aware Filtering
Objective: To select a final set of designs that are both high-quality and diverse.
Procedure:
- After generating a large decoy set (N>50,000), calculate a multi-objective score: [Composite Score = A * (Normalized Energy) + B * (Normalized PSSM Score) + C * (Diversity Penalty)].
- Diversity Penalty for a given decoy is its average similarity to the n already-selected designs.
- Use an iterative selection algorithm:
- Step 1: Select the top 1% by composite score (with C=0).
- Step 2: Cluster these by sequence identity (e.g., at 70% cutoff).
- Step 3: From each cluster, select the best-scoring design.
- Step 4: This forms the initial diverse set. Now, with C>0, re-rank the remaining decoys to favor sequences different from this set.
- Step 5: Iterate steps 3-4 until the desired number of designs is selected.
The Scientist's Toolkit: Research Reagent Solutions
Table 2: Essential Tools for Diversity-Optimized EvoDesign
| Item / Reagent | Provider / Example | Primary Function in Troubleshooting |
|---|---|---|
| Metagenomic Sequence Databases | MGnify, JGI IMG, UniRef90 | Provides evolutionarily distant homologs to enrich MSA diversity (Protocol 2). |
| MSA Processing Suite | HMMER (hhblits, jackhmmer), PSI-BLAST | Generates and weights sequence profiles; sensitive searching is key. |
| Protein Language Model (pLM) | ESM-2, ProtT5 | Used to generate a plm score as a prior, encouraging "native-like" but diverse sequences, bypassing conservation bias. |
| All-Atom Molecular Dynamics (MD) Software | GROMACS, AMBER, OpenMM | Validates that diverse designs maintain structural integrity under simulation (Post-Protocol 3). |
| High-Throughput Cloning & Expression Kit | Gibson Assembly Master Mix, NEB Golden Gate, Purification kits | Enables rapid experimental testing of a diverse panel of designs to validate functional stability. |
| Differential Scanning Fluorimetry (DSF) Assay Kit | SYPRO Orange dye, Real-Time PCR Instrument | Provides medium-throughput thermal stability (Tm) data to correlate sequence diversity with biophysical properties. |
Validation & Iteration Workflow
The final, integrated troubleshooting workflow is encapsulated in the following diagram, illustrating the closed-loop process from diagnosis to validated design.
Diagram: Diversity Troubleshooting Loop
Conclusion: By systematically diagnosing the source of constraint and applying the targeted protocols outlined herein, researchers can effectively troubleshoot the EvoDesign protocol. This ensures the generation of protein variants that harness evolutionary wisdom without being enslaved by it, a core tenet of the broader thesis on computationally driven protein optimization for novel therapeutics and enzymes.
This document provides application notes and protocols for a critical module within the broader EvoDesign framework for de novo protein design and optimization. The core thesis of EvoDesign posits that optimal protein sequences emerge from a balanced fitness function that integrates evolutionary constraints (derived from homologous sequence families) with physical energy terms (describing atomic-level interactions). This module, "Adjusting Parameters," details the methodology for determining the optimal weighting coefficients (α, β) that balance these two foundational components of the energy function: E_total = α * E_evolutionary + β * E_physical.
Core Quantitative Data & Parameter Ranges
The following tables summarize key parameters, their typical ranges, and performance metrics from recent implementations.
Table 1: Standard Weighting Parameters for Fitness Function
| Parameter | Symbol | Typical Range | Description | Recommended Starting Point |
|---|---|---|---|---|
| Evolutionary Term Weight | α | 0.1 - 2.0 | Scales the contribution of sequence profile (e.g., PSSM) and co-evolutionary data. Higher values favor natural sequence likelihood. | 1.0 |
| Physical Energy Term Weight | β | 0.5 - 3.0 | Scales the contribution of physical force fields (e.g., Rosetta, AMBER, CHARMM). Higher values favor stereochemical quality. | 1.0 |
| Pareto Optimal Threshold | ΔG (kcal/mol) | ≤ -7.0 | Target stability threshold for designed variants during parameter screening. | -8.0 |
| Sequence Recovery Rate Target | % | ≥ 40% | Target for recovering wild-type amino acids at variable positions when using native backbone. | 45% |
Table 2: Performance Metrics from Recent Studies (2023-2024)
| Study (Primary Tool) | Optimal (α, β) Pair | Sequence Recovery (%) | Predicted ΔΔG (kcal/mol) | Experimental Success Rate* |
|---|---|---|---|---|
| RFdiffusion+Rosetta (2024) | (0.8, 1.5) | 52 | -1.2 | 24% (Stable folds) |
| ProteinMPNN+AlphaFold2 (2023) | (1.2, 0.9) | 61 | -0.8 | 18% (High accuracy) |
| EvoDesign (Classic) | (1.0, 1.0) | 48 | -1.5 | 22% (Functional designs) |
| *Experimental success indicates expressed, soluble, and correctly folded protein. |
Experimental Protocols
Protocol 3.1: Grid Search for Parameter Optimization
Objective: Empirically determine the (α, β) pair that maximizes both sequence plausibility and structural stability. Materials: Multiple Sequence Alignment (MSA) of target family, high-resolution template structure, computational design suite (e.g., Rosetta), high-performance computing cluster. Procedure:
- Define Grid: Establish a 2D grid for α (range 0.1-2.0, step 0.2) and β (range 0.5-3.0, step 0.3).
- Generate Designs: For each (α, β) node on the grid, run the EvoDesign protocol to generate 100-200 de novo sequence variants for the target scaffold.
- Evaluate Designs: For each generated variant, compute:
- Evolutionary Score: Log-likelihood of the sequence given the PSSM.
- Physical Energy Score: Rosetta
ref2015orbeta_nov16total energy. - In-silico Folding Confidence: Predict structure with AlphaFold2 or ESMFold and calculate pLDDT/TM-score against scaffold.
- Identify Pareto Frontier: Plot all designs in a 3D space (Evolutionary Score, Physical Energy, Folding Confidence). Identify non-dominated points where improving one metric degrades another.
- Select Optimal Zone: The optimal (α, β) range corresponds to the grid nodes that produce the highest density of designs on the Pareto frontier. Validate with downstream filters (predicted stability, solubility).
Protocol 3.2: Retrospective Benchmarking & Calibration
Objective: Calibrate α and β weights using a dataset of known stable proteins. Materials: Non-redundant set of 50-100 high-resolution protein structures with known stable variants, corresponding deep MSAs. Procedure:
- Prepare Benchmark: For each wild-type structure, generate a series of single-point mutants (5-10 per protein) with known stability data (ΔΔG).
- Compute Component Energies: For each mutant, compute the change in evolutionary score (ΔEevo) and physical energy (ΔEphys) relative to wild-type.
- Linear Regression: Perform multivariable linear regression:
Experimental ΔΔG ≈ α * ΔE_evo + β * ΔE_phys + c. - Extract Weights: The fitted coefficients α and β from the regression model provide a data-driven weighting scheme. Cross-validate using leave-one-protein-out methods.
Protocol 3.3: Iterative Feedback Loop for Therapeutic Proteins
Objective: Adjust parameters based on experimental feedback from initial design rounds. Materials: Initial designed library (cloned and expressed), data from Expression Level (SDS-PAGE), Solubility (clear-native PAGE), and Thermal Shift Assay (Tm). Procedure:
- Round 1 Design: Use balanced starting weights (α=1.0, β=1.0). Express and characterize 96 designs.
- Data Bin: Categorize designs into: Hits (soluble, high Tm), Intermediate (soluble, low Tm), Failures (insoluble).
- Parameter Re-clustering: Calculate the mean (α, β) values used to generate sequences in each bin.
- Shift Parameter Focus: If Failures have high α (overly constrained), reduce α by 25% for next round. If Intermediate have low β (poor packing), increase β by 30%.
- Iterate: Perform 2-3 design rounds, focusing the search around the parameter region that produces the highest hit rate.
Visualization of Workflows & Relationships
Title: Core EvoDesign Parameter Balancing Logic
Title: Grid Search Parameter Optimization Workflow
Title: Iterative Parameter Tuning Based on Experiment
The Scientist's Toolkit: Research Reagent Solutions
Table 3: Essential Materials & Computational Tools for Parameter Balancing
| Item / Reagent | Category | Function in Protocol | Example / Vendor |
|---|---|---|---|
| Deep Multiple Sequence Alignment | Data Input | Provides evolutionary constraints for calculating E_evo. Source for Position-Specific Scoring Matrix (PSSM). | JackHMMER (EMBL-EBI), MMseqs2 (UniProt), UniRef90 database. |
| High-Resolution Protein Structure | Data Input | Scaffold for design. Required for calculating physical energy terms (E_phys). | PDB template (RCSB), AlphaFold2 prediction (AlphaFold DB). |
| Rosetta Software Suite | Computational Tool | Primary engine for calculating physical energy terms (ref2015, beta_nov16) and performing sequence design. |
RosettaCommons (Academic License). |
| AlphaFold2 or ESMFold | Computational Tool | Used for in-silico folding confidence assessment (pLDDT, TM-score) of designed sequences. | ColabFold (public server), local installation. |
| Clustered Regularly Interspaced Short Palindromic Repeats (CRISPR) sgRNA Libraries | Experimental Validation (Therapeutics) | For high-throughput in-vivo functional screening of designed protein variants in cellular models. | Synthego, Integrated DNA Technologies (IDT). |
| Thermal Shift Dye (e.g., SYPRO Orange) | Experimental Validation | Used in Thermal Shift Assay (TSA) to measure melting temperature (Tm) and assess stability of purified designs. | Thermo Fisher Scientific, Sigma-Aldrich. |
| High-Performance Computing (HPC) Cluster | Infrastructure | Essential for running large-scale grid searches (1000s of design simulations) in parallel. | Local university cluster, AWS EC2 (Amazon Web Services), Google Cloud Platform. |
| Plasmid Library Cloning Kit | Molecular Biology | For rapid construction of variant libraries for experimental testing after design. | Gibson Assembly Master Mix (NEB), Golden Gate Assembly Kit (BsaI-HFv2). |
Addressing Structural Instability or Unrealistic Geometries in Output Models
Application Notes: Structural Validation and Refinement in EvoDesign Protocols
Within the EvoDesign paradigm for computational protein optimization, a critical post-design challenge is the manifestation of structural instability or unrealistic geometries in in silico output models. These artifacts, often stemming from conformational sampling limitations or force field inaccuracies, can undermine the experimental viability of designed proteins. The following notes and protocols outline a systematic validation and refinement pipeline.
Table 1: Key Metrics for Structural Validation
| Metric | Target Range | Tool/Software (Example) | Purpose |
|---|---|---|---|
| MolProbity Clashscore | < 10 (Top 1% of structures) | MolProbity / PHENIX | Identifies severe atomic overlaps. |
| Ramachandran Outliers | < 0.5% | MolProbity / PROCHECK | Flags unrealistic protein backbone dihedral angles. |
| Rotamer Outliers | < 1.0% | MolProbity | Identifies unlikely side-chain conformations. |
| Cβ Deviation | 0 Å (All residues) | WHAT_CHECK | Detects backbone irregularities. |
| PackDock Score | > 0.65 (per residue) | Rosetta / PyRosetta | Measures side-chain packing quality. |
| ΔΔG Fold (ddG) | < 0 (kcal/mol) | FoldX / Rosetta | Estimates mutational impact on folding stability. |
Experimental Protocols
Protocol 1: Iterative Structural Relaxation and Clash Remediation Objective: Minimize atomic clashes and improve local geometry while preserving the global fold.
- Input Preparation: Load the designed protein model (PDB format).
- Energy Minimization: Execute constrained minimization using the Rosetta FastRelax algorithm or CHARMM with harmonic restraints on Ca atoms (force constant: 0.5 kcal/mol/Ų). This allows local adjustment while maintaining overall topology.
- Constraint Application: Apply dihedral angle constraints derived from the initial model's secondary structure to prevent drastic backbone distortion.
- Iteration: Perform 5-10 relaxation trajectories. Select the lowest energy model (by Rosetta total_score or similar) for validation.
- Validation Check: Run the relaxed model through MolProbity. If clashes persist, proceed to Protocol 2.
Protocol 2: Targeted Backbone and Side-Chain Redesign of Problematic Regions Objective: Redesign localized regions with persistent outliers.
- Hotspot Identification: Using validation results (Table 1), flag residues with Clashscore > 0.5, Ramachandran outliers, or poor PackDock scores.
- Fragment Library Insertion: For backbone issues, use Rosetta Remodel to insert short (3-9 residue) backbone fragments from high-resolution crystal structures into problematic loops/regions.
- Sequence Redesign: Locally redesign side-chain identities and conformations (Rosetta FixBB) around the remodeled backbone, allowing sequence changes within the EvoDesign-defined functional constraints.
- Ensemble Generation & Selection: Generate 100-200 redesign decoys. Filter for lowest energy, followed by re-validation against all metrics in Table 1.
Visualizations
Title: EvoDesign Structural Refinement Workflow
Title: Validation Decision Tree for Model Correction
The Scientist's Toolkit
Table 2: Essential Research Reagent Solutions for Structural Validation
| Item | Function in Protocol | Example / Specification |
|---|---|---|
| Rosetta Software Suite | Core engine for relaxation (FastRelax), local redesign (FixBB), and backbone remodeling. Provides energy scores for selection. | RosettaCommons release or PyRosetta. |
| MolProbity Server | Provides comprehensive all-atom contact analysis (clashscore), Ramachandran, and rotamer evaluation. Critical for validation steps. | molprobity.berkeley.edu. |
| High-Resolution Fragment Libraries | Source of realistic local backbone geometries for repairing problematic loops in Protocol 2. | Pre-generated from PDB or using Robetta server. |
| PHENIX Toolkit | Suite for macromolecular structure solution, includes phenix.geometry_minimization for alternative refinement. |
phenix-online.org. |
| FoldX Force Field | Rapid calculation of protein stability (ΔΔG) upon mutation or to verify designs post-refinement. | foldxsuite.org. |
| Constraint Files (CIF/XML) | Define harmonic restraints for Ca atoms or dihedral angles during minimization to prevent over-distortion. | Generated by PDB2CON or manually. |
Strategies for When Experimental Validation Contradicts Computational Predictions
Within the EvoDesign framework for protein optimization, a core premise is the iterative refinement of computational predictions through experimental feedback. A significant challenge arises when high-confidence in silico predictions, such as those for protein stability, binding affinity, or catalytic activity, fail to correlate with experimental measurements. This discrepancy demands systematic investigation to refine computational models, rescue experimental efforts, and advance the design cycle. These application notes provide a structured protocol for diagnosing and resolving such contradictions.
Phase 1: Systematic Re-examination
When a contradiction is first observed, a methodical review of both computational and experimental procedures is essential before concluding a model failure.
Protocol 1.1: Computational Audit Trail
Objective: Verify the integrity and assumptions of the prediction pipeline. Methodology:
- Input Data Fidelity: Re-check the sequence and structure files used as input for mutations. Confirm PDB IDs, chain identifiers, and residue numbering.
- Parameter Sensitivity: Re-run predictions with alternate, standard parameters. For example, in folding energy (ΔΔG) calculations using Rosetta or FoldX, test different force fields and relaxation protocols.
- Ensemble vs. Single Structure: Assess if predictions were made on a single static structure or an ensemble from molecular dynamics (MD). If static, run a short (50-100 ns) MD simulation of the wild-type and variant to check for conformational flexibility that might alter residue contacts.
- Control Predictions: Run the computational method on a set of known benign and deleterious mutations (e.g., from ProTherm) to confirm its baseline accuracy on the day of analysis.
Protocol 1.2: Experimental Result Verification
Objective: Confirm the reliability of the contradictory experimental data. Methodology:
- Reagent Validation: Sequence-verify all plasmid constructs for the designed variant. Confirm protein purity and concentration via SDS-PAGE and absorbance (A280) with an accurate extinction coefficient.
- Assay Controls: Repeat the experiment with internal positive and negative controls within the same plate/run. For binding assays (e.g., SPR, BLI), include a reference channel and a well-characterized ligand-receptor pair.
- Technical Replicates: Perform the experiment with at least three independent biological replicates (different protein preparations) each with three technical replicates.
- Orthogonal Assay: Measure the property in question using a different technique. If thermal shift assay (Tm) suggests destabilization, validate with differential scanning calorimetry (DSC) or chemical denaturation.
Table 1: Quantitative Data from Initial Verification
| Variant | Predicted ΔΔG (kcal/mol) | Experimental Tm (°C) | DSC Tm (°C) | Binding Affinity SPR (KD, nM) | Binding Affinity ITC (KD, nM) |
|---|---|---|---|---|---|
| Wild-Type | 0.0 | 62.1 ± 0.3 | 61.8 ± 0.2 | 10.2 ± 1.1 | 12.5 ± 2.3 |
| Design-01 (Discrepant) | -2.5 (Stabilizing) | 55.4 ± 0.5 | 54.9 ± 0.4 | >10,000 | N/D |
| Known Stabilizing Ctrl | -1.8 | 64.5 ± 0.3 | 64.0 ± 0.3 | 9.8 ± 1.5 | 11.1 ± 3.0 |
| Known Destabilizing Ctrl | +3.2 | 48.2 ± 0.7 | 47.5 ± 0.5 | >10,000 | N/D |
Phase 2: In-Depth Investigative Analysis
If the contradiction persists after verification, deeper investigation into molecular causes is required.
Protocol 2.1: Structural Characterization
Objective: Obtain experimental structural data on the variant. Methodology:
- Rapid Crystallography: If crystallography is established for the protein, attempt co-crystallization of the variant. Focus on identifying changes in electron density at the mutation site and surrounding loops.
- Hydrogen-Deuterium Exchange Mass Spectrometry (HDX-MS): Probe regional stability and dynamics. Labeling time points: 10s, 1min, 10min, 60min, 4h. Compare deuteration levels between wild-type and variant to identify regions with increased/decreased flexibility.
- Solution NMR: For proteins ≤ 30 kDa, collect 2D 1H-15N HSQC spectra. Significant chemical shift perturbations or peak broadening indicate structural perturbations or aggregation.
Protocol 2.2: Advanced Computational Analysis
Objective: Use more sophisticated simulations to generate testable hypotheses. Methodology:
- Long-Timescale MD Simulations: Run triplicate 500 ns – 1 µs simulations for both wild-type and variant. Analyze:
- Root-mean-square fluctuation (RMSF) of residues.
- Stability of key hydrogen bonds or salt bridges.
- Formation of new, non-native interactions.
- Solvent accessibility of the mutation site.
- Constant-pH MD (CpHMD): If the mutation involves titratable residues (Asp, Glu, His, Lys, Arg), perform CpHMD to assess if the contradiction stems from an incorrect protonation state assumption in the standard prediction.
- Free Energy Perturbation (FEP): Compute the relative binding free energy or solvation free energy using FEP for a more rigorous in silico estimate compared to scoring functions.
Table 2: Analysis of Investigative MD Simulations
| Metric | Wild-Type (Avg ± SD) | Design-01 Variant (Avg ± SD) | Interpretation |
|---|---|---|---|
| Global RMSD (Å) | 1.52 ± 0.21 | 2.38 ± 0.34 | Variant is more conformationally divergent. |
| Residue 105-115 Loop RMSF (Å) | 1.1 ± 0.3 | 2.8 ± 0.6 | Critical binding loop is highly destabilized. |
| Salt Bridge (Asp32-Arg65) Occupancy (%) | 98.5 | 12.3 | Key stabilizing interaction is lost. |
| New Hydrophobic Cluster (Ile107, Phe110) | Not present | 85% occupancy | Non-native cluster distorts active site geometry. |
Phase 3: Resolution and Model Updating
The final phase integrates findings to resolve the contradiction and improve the EvoDesign protocol.
Protocol 3.1: Iterative Model Refinement
Objective: Use experimental data to retrain or adjust the computational scoring function. Methodology:
- Feature Engineering: Incorporate new MD-derived metrics (e.g., salt bridge occupancy, loop stability) as additional terms in the Rosetta energy function or machine learning model.
- Re-weighting: Adjust the weights of existing energy terms (e.g., electrostatics, solvation) based on the discrepancy between predicted and experimental ΔΔG values for the variant and related controls.
- Active Learning: Formally add the discrepant variant and its characterized properties to the training set of the predictive algorithm for future rounds of design.
Diagram Title: Workflow for Resolving Prediction-Experiment Contradictions
Diagram Title: From Static Assumption to Dynamic Understanding
The Scientist's Toolkit: Research Reagent Solutions
| Item | Function in Investigation |
|---|---|
| Site-Directed Mutagenesis Kit (e.g., Q5) | Rapid, high-fidelity generation of variant constructs for experimental testing. |
| SEC-MALS Columns | Size-exclusion chromatography with multi-angle light scattering to detect aggregation states not seen on SDS-PAGE. |
| Thermofluor Dyes (e.g., SYPRO Orange) | High-throughput thermal shift assay to screen variant stability under different buffers/pH conditions. |
| HDX-MS Liquid Handling System | Automated, reproducible deuterium labeling and quenching for conformational dynamics analysis. |
| Crystallization Screening Robots | Enable high-throughput crystallization trials of discrepant variants for structural insights. |
| GPU Computing Cluster | Essential for running long-timescale MD and FEP calculations in a feasible timeframe. |
| SPR/BLI Biosensor Chip (e.g., Ni-NTA, CMS) | For immobilizing his-tagged proteins to accurately measure weak binding affinities of destabilized variants. |
| Reference Data Curation (e.g., ProTherm, SKEMPI 2.0) | Public databases of experimental protein stability and binding data for control predictions and model training. |
Optimizing Computational Cost and Runtime for Large-Scale Design Campaigns
Within the context of the EvoDesign protocol for protein optimization research, scaling computational campaigns from single-target designs to large-scale, multi-variant libraries presents significant challenges in resource management. The primary bottlenecks are the exponential growth in computational expense and wall-clock runtime associated with high-throughput in silico folding (e.g., AlphaFold2, RoseTTAFold) and binding affinity predictions (e.g., MM/GBSA, docking). This document outlines application notes and protocols to optimize these parameters without sacrificing the robustness of the evolutionary sequence search and structural evaluation that underpin EvoDesign.
Quantitative Analysis of Computational Bottlenecks
The table below summarizes the typical computational cost for key stages in a large-scale EvoDesign campaign targeting 10,000 design variants.
Table 1: Computational Cost Breakdown for a 10k-Variant Campaign
| Stage | Tool/Method | Avg. Time per Variant (GPU/CPU hrs) | Total Compute (hrs) | Estimated Cloud Cost (USD)* |
|---|---|---|---|---|
| 1. Sequence Generation | EvoDesign (MCMC) | 0.02 (CPU) | 200 CPU | ~$5 |
| 2. Structure Prediction | AlphaFold2 (multimer) | 0.5 (GPU, A100) | 5,000 GPU | ~$1,500 |
| 3. Affinity Assessment | Molecular Docking | 0.1 (CPU) | 1,000 CPU | ~$25 |
| 4. Stability Scoring | FoldX/MM/GBSA | 0.05 (CPU) | 500 CPU | ~$12 |
| 5. Filtering & Analysis | Custom Scripts | 0.01 (CPU) | 100 CPU | ~$2 |
| TOTAL (Naïve Pipeline) | ~5,800 hr | ~$1,544 | ||
| TOTAL (Optimized Pipeline) | (See Section 3) | ~1,200 hr | ~$350 |
*Cost estimates based on AWS pricing (p4d.24xlarge instances ~$32.77/hr for 8xA100; c5.18xlarge ~$3.06/hr for 72 vCPUs) and assuming optimal parallelization.
Core Optimization Protocols
Protocol 3.1: Tiered Filtration with Rapid Preliminary Scoring
Objective: To reduce the number of variants requiring full atomic-level simulation by over 80%.
Detailed Methodology:
- Primary Filter (Sequence Space): Apply lightweight, conserved scoring functions immediately after MCMC sequence generation.
- Tools: PSSM (Position-Specific Scoring Matrix) score threshold, physicochemical property filters (net charge, hydrophobicity index).
- Action: Reject variants deviating >2σ from wild-type profiles. Expected retention: 60%.
- Secondary Filter (Coarse-Grained Structure): Use ultra-fast folding tools for topological assessment.
- Tools: ESMFold (~10 sec/variant on GPU). Generate predicted local distance difference test (pLDDT) and predicted aligned error (PAE).
- Action: Reject variants with pLDDT < 70 or poor PAE in the binding interface region. Expected retention: 40% of primary.
- Tertiary Filter (Fast Binding Metrics): Employ heuristic or machine learning-based affinity estimators.
- Tools:
ProteinMPNNfor inverse folding score (sequence likelihood given backbone), orRFdiffusioninterface score. - Action: Rank remaining variants (~24% of total). Select top 20% for Stage 4.
- Tools:
- Quaternary Analysis (High-Fidelity Simulation): Apply full atomic-detail methods only to the filtered library.
- Tools: AlphaFold2 multimer for final structure, followed by MM/GBSA (Molecular Mechanics/Generalized Born Surface Area) or rigorous docking.
- Action: Perform detailed analysis on <5% of the initial sequence pool.
Visualization of Tiered Filtration Workflow
Diagram Title: Tiered Filtration Workflow for Large-Scale EvoDesign
Protocol 3.2: Strategic Parallelization & Cloud HPC Configuration
Objective: Minimize wall-clock runtime through optimal resource orchestration.
Detailed Methodology:
- Pipeline Architecture: Implement a directed acyclic graph (DAG) using workflow managers (Nextflow, Snakemake) to manage dependencies and allow non-linear execution where possible.
- Resource-Tiered Queuing:
- Queue A (High-Memory CPU): For primary sequence filters and post-processing.
- Queue B (Single GPU): For ESMFold and ProteinMPNN inference.
- Queue C (Multi-GPU Batch): For batch AlphaFold2 predictions (using
--max_template_date=1900-01-01to skip BLAST for speed).
- Containerization: Use Docker/Singularity containers for all tools (AlphaFold2, Rosetta) to ensure reproducibility and eliminate environment setup overhead.
- Data Caching: Store and reuse frequently accessed databases (e.g., PDB, UniRef) on high-speed local NVMe storage attached to compute nodes.
Protocol 3.3: Integration of Surrogate Machine Learning Models
Objective: Replace a subset of physics-based calculations with faster, pre-trained ML emulators.
Detailed Methodology:
- Training Data Generation: Run full EvoDesign pipeline on a representative, smaller library (500-1000 designs). Use outputs (sequences, AlphaFold2 structures, MM/GBSA scores) as labeled training data.
- Model Selection & Training: Train a gradient-boosting (XGBoost) or transformer-based model to predict the final MM/GBSA or docking score directly from the variant's sequence and ESMFold embeddings.
- Deployment in Production Pipeline: Insert the trained ML model as the Tertiary Filter (Protocol 3.1, Step 3). Variants predicted to have favorable scores bypass initial docking and proceed directly to selective, confirmatory MM/GBSA.
The Scientist's Toolkit: Key Research Reagent Solutions
Table 2: Essential Computational Reagents for Optimized EvoDesign Campaigns
| Reagent/Tool | Category | Primary Function in Optimization | Key Parameter for Cost Control |
|---|---|---|---|
| ESMFold | Structure Prediction | Provides ultra-fast (seconds) coarse-grained 3D models for initial structural viability screening. | Batch inference on single GPU; no MSA step reduces I/O. |
| ProteinMPNN | Sequence Design | Provides inverse folding score as a rapid proxy for sequence-structure compatibility and stability. | Fast inference on GPU; can batch thousands of sequences. |
| ColabFold | Structure Prediction | Cloud-optimized AlphaFold2 implementation with integrated MMseqs2 for accelerated MSA generation. | Automatic use of templates can be disabled (--template_mode none) for speed. |
| Rosetta (ddG_monomer) | Stability Scoring | Calculates binding free energy changes (ΔΔG) upon mutation with high accuracy. | Use -relax:fast flag and increase -jd2:ntrials for balanced speed/accuracy. |
| OpenMM | Molecular Dynamics | GPU-accelerated engine for running short MD simulations or MM/GBSA calculations. | Configure to run entirely on GPU (CUDA/OpenCL platform). |
| Nextflow / Snakemake | Workflow Management | Enables seamless, scalable, and reproducible pipeline execution across local and cloud HPC clusters. | Optimize process directives (cpus, memory, queue) to match resources. |
| AWS Batch / Google Cloud Life Sciences | Cloud HPC | Managed batch computing services for dynamic scaling of compute-intensive pipeline stages. | Use spot/preemptible instances for cost-saving on fault-tolerant jobs. |
Benchmarking EvoDesign: Validation Strategies and Comparison to RFdiffusion & AlphaFold
Within the broader thesis on the EvoDesign protocol for protein optimization, this document details the critical validation phase. EvoDesign employs evolutionary constraints and force-field calculations to generate novel protein sequences with optimized stability and function. This application note provides a framework for moving from in silico predictions to experimentally validated designs, establishing a gold-standard pipeline that integrates computational metrics with biochemical and biophysical assays.
Computational Metrics for Initial Triage
Prior to experimental investment, candidate proteins from EvoDesign must be evaluated using a suite of complementary computational metrics. The following table summarizes key metrics, their interpretation, and suggested thresholds for progression.
Table 1: Computational Validation Metrics for EvoDesign Candidates
| Metric Category | Specific Metric | Ideal Range/Rule | Rationale & Tool Example |
|---|---|---|---|
| Structural Integrity | Predicted TM-score (to template) | >0.7 | Indicates correct fold. (USalign, DeepTMScore) |
| Rosetta/AlphaFold2 pLDDT | >80 (core), >70 (overall) | Per-residue and global confidence in model. (ColabFold) | |
| MolProbity Clashscore | <5 | Steric clashes and rotamer outliers. (MolProbity) | |
| Stability | ΔΔG FoldX/ Rosetta (kcal/mol) | < 0 (negative) | Predicted change in folding free energy vs. wild-type. (FoldX) |
| Aggregation Propensity (Zagg) | < 0 (negative) | Lower propensity for aggregation (TANGO, AGGRESCAN). | |
| Function Preservation/ Gain | Computational Alanine Scanning | Identify key binding/active site residues. | Predicts hotspot residues. (Robetta, FoldX) |
| Docking Score (if applicable) | Lower (better) than WT | Predictive binding affinity to target. (HADDOCK, AutoDock) | |
| Developability | Net Charge, Isoelectric Point (pI) | pI away from formulation pH | Influences solubility and viscosity. (ProtParam) |
| Hydrophobicity Index | Context-dependent optimization | Balance for expression and stability. |
Application Notes: Integrated Validation Workflow
The validation pipeline proceeds from computational screening to iterative experimental testing. Each phase provides feedback to refine the EvoDesign parameters.
Core Concept: A high-ranking candidate must pass sequentially more stringent and resource-intensive experimental gates. Failure at any gate necessitates a return to the computational design pool.
Diagram 1: Integrated Validation Workflow with Feedback
Detailed Experimental Protocols
Protocol 1: Gate 1 - High-Throughput Expression & Solubility Screen
Objective: Rapid assessment of protein expression yield and solubility in E. coli.
Materials: See "Scientist's Toolkit" below. Procedure:
- Cloning: Clone gene sequences for 24 top-ranking EvoDesign candidates into a T7-driven expression vector (e.g., pET series) using Gibson Assembly, generating N-terminal His₆-tag fusions.
- Transformation: Transform each construct into BL21(DE3) E. coli cells. Plate on LB-agar with appropriate antibiotic.
- Micro-expression Test: a. Pick single colonies into 1 mL deep-well blocks containing 0.5 mL auto-induction media (e.g., Overnight Express). Grow for 24 hours at 30°C, 900 rpm. b. Harvest cells by centrifugation (4000 x g, 15 min).
- Solubility Analysis: a. Resuspend pellets in 150 µL Lysis Buffer (50 mM Tris-HCl pH 8.0, 300 mM NaCl, 1 mg/mL lysozyme, 1x protease inhibitor, 0.1% Triton X-100). b. Lyse by freezing at -80°C for 30 min, then thaw at room temperature. c. Centrifuge at 4,000 x g for 30 min to separate soluble (S) and insoluble (I) fractions. d. Load 15 µL of total lysate (T), soluble (S), and insoluble (I) fractions for each construct on an SDS-PAGE gel. e. Stain with Coomassie Blue or use Western blot with anti-His antibody.
- Analysis: Quantify band intensity. A candidate "passes" if >50% of the expressed protein is in the soluble fraction.
Protocol 2: Gate 2 - Biophysical Characterization (Thermal Shift Assay & SEC-MALS)
Objective: Determine conformational stability and oligomeric state.
Part A: Thermal Shift Assay (TSA)
- Setup: Use a real-time PCR instrument. In a 96-well plate, mix 10 µL of purified protein (0.2-0.5 mg/mL in formulation buffer) with 10 µL of 10X SYPRO Orange dye.
- Run: Perform a thermal ramp from 25°C to 95°C at a rate of 1°C/min, monitoring fluorescence.
- Analysis: Derive the melting temperature (Tm) from the first derivative of the fluorescence curve. A successful design typically shows a Tm increase of >5°C over the wild-type or a Tm > 45°C.
Part B: Size-Exclusion Chromatography with Multi-Angle Light Scattering (SEC-MALS)
- Setup: Equilibrate an analytical SEC column (e.g., Superdex 200 Increase 3.2/300) with filtered buffer (e.g., 20 mM HEPES, 150 mM NaCl, pH 7.4).
- Injection: Inject 50 µL of purified protein at 1-2 mg/mL.
- Detection: Use an online triple-detector system (UV, MALS, dRI).
- Analysis: Determine the absolute molecular weight from the MALS/dRI data. A "pass" requires >90% monomeric peak with a calculated MW within 5% of the theoretical mass.
Protocol 3: Gate 3 - Functional Activity Assay (Enzyme Kinetics Example)
Objective: Quantify catalytic efficiency (kcat/Km) of optimized enzymes.
Procedure:
- Substrate Titration: In a 96-well plate, add a fixed concentration of purified enzyme (nM range) to varying concentrations of substrate (spanning 0.2-5 x estimated Km) in assay buffer.
- Kinetic Measurement: Monitor product formation continuously (e.g., absorbance, fluorescence) for 5-10 minutes using a plate reader.
- Data Analysis: Fit the initial velocity (v0) data to the Michaelis-Menten equation:
v0 = (Vmax * [S]) / (Km + [S]). - Validation: Compare kcat (Vmax/[E]) and Km to wild-type. A successful design should maintain or improve catalytic efficiency (kcat/Km).
The Scientist's Toolkit
Table 2: Key Research Reagent Solutions & Materials
| Item | Function in Validation | Example Product/Kit |
|---|---|---|
| Cloning & Expression | ||
| Gibson Assembly Master Mix | Seamless, high-efficiency cloning of designed gene variants. | NEBuilder HiFi DNA Assembly |
| Chemocompetent E. coli BL21(DE3) | Standard protein expression host for T7-driven vectors. | NEB BL21(DE3) |
| Auto-induction Media | Simplifies expression screening; induces upon carbon source depletion. | Overnight Express Autoinduction Systems |
| Purification & Detection | ||
| Ni-NTA Magnetic Beads | Rapid, small-scale IMAC purification for screening. | HisPur Ni-NTA Magnetic Beads |
| Anti-His Tag Antibody (HRP) | Detection of His-tagged proteins in Western blots. | Thermo Fisher Scientific MA1-21315-HRP |
| SYPRO Orange Protein Gel Stain | Fluorescent dye for thermal shift assays; binds hydrophobic patches. | Sigma-Aldrich S6650 |
| Biophysical Analysis | ||
| Superdex Increase SEC Columns | High-resolution size-based separation for SEC-MALS. | Cytiva Superdex 200 Increase 10/300 GL |
| MALS/dRI Detector System | Determines absolute molecular weight and oligomeric state. | Wyatt miniDAWN TREOS |
| Differential Scanning Calorimetry (DSC) Capillaries | Gold-standard for measuring thermal unfolding enthalpy. | Malvern MicroCal VP-Capillary DSC |
| Functional Assays | ||
| Chromogenic/ Fluorogenic Substrate | Enables direct, continuous measurement of enzyme activity. | Custom synthesis or vendors (e.g., Sigma, Tocris) |
| Microplate Reader with Temperature Control | Essential for running kinetic assays and thermal shifts. | BioTek Synergy H1 or equivalent |
Diagram 2: Biophysical Assay Decision Logic
This integrated validation framework bridges the gap between the computational predictions of EvoDesign and real-world protein performance. By employing a gated, feedback-informed strategy that synergizes computational metrics with standardized experimental protocols, researchers can efficiently identify robust, high-quality protein variants. This gold-standard approach de-risks the protein optimization pipeline, accelerating progress in therapeutic and industrial enzyme development.
Application Notes & Comparative Analysis
Protein design methodologies can be broadly categorized into evolution-informed (EvoDesign) and deep learning-based (RFdiffusion, ProteinMPNN) approaches. Their core philosophies, applications, and outputs differ significantly.
Philosophical & Methodological Comparison
EvoDesign operates on the principle of evolutionary conservation. It leverages multiple sequence alignments (MSAs) of homologous proteins to infer a statistical potential (e.g., an edge-weighted graph or a position-specific scoring matrix). This potential captures co-evolutionary constraints, identifying residues that are evolutionarily coupled. The protocol then performs in-silico sequence optimization on a fixed or flexible backbone to propose sequences that satisfy these natural evolutionary rules, aiming for stability and native-like foldability.
Deep Learning Methods learn directly from the structural data in the Protein Data Bank (PDB).
- RFdiffusion: A generative diffusion model that creates novel protein backbones from noise, conditioned on user-defined specifications (e.g., symmetric oligomers, shape, functional site scaffolding). It excels at de novo backbone generation.
- ProteinMPNN: A fast, robust inverse folding model based on a graph neural network. Given a protein backbone, it predicts optimal amino acid sequences that are likely to fold into that structure. It excels at sequence design for given scaffolds.
Table 1: Comparative Performance Metrics of Protein Design Methods
| Metric | EvoDesign | ProteinMPNN | RFdiffusion | Notes |
|---|---|---|---|---|
| Primary Function | Sequence optimization & stabilization | Sequence design for fixed backbone | De novo backbone generation | Core distinction |
| Design Speed | ~Minutes to hours per run | ~Seconds per backbone | ~Minutes per generated backbone (GPU) | ProteinMPNN is exceptionally fast |
| Experimental Success Rate (Foldability) | High (>50%) for natural folds | Very High (>70%) for de novo monomers | High for symmetric, lower for asymmetric | Rates depend heavily on target complexity |
| Novelty Horizon | Limited by natural MSAs; extrapolative | High for known folds | Very High; can create unprecedented topologies | RFdiffusion enables topological invention |
| Input Requirement | Multiple Sequence Alignment (MSA) | 3D Backbone Coordinates (PDB format) | Conditioning cues (symmetry, motifs, noise) | EvoDesign requires evolutionary data |
| Key Output | Optimized protein sequence | Optimized protein sequence | Novel protein backbone structure |
Strengths and Limitations: A Strategic View
Table 2: Strategic Strengths and Limitations
| Method | Core Strengths | Key Limitations |
|---|---|---|
| EvoDesign | • Designs sequences with high naturalness and stability.• Excellent for functional site preservation and ortholog design.• Less reliant on large-scale structural data; uses sequence information.• Strong theoretical link to evolutionary biophysics. | • MSA-Dependent: Performance degrades with shallow/no MSA.• Limited de novo creativity: Primarily optimizes/exploits existing folds.• Computational cost scales with MSA depth and graph complexity. |
| Deep Learning (RFdiffusion/ProteinMPNN) | • Unprecedented design novelty (RFdiffusion).• Extreme speed and scalability (ProteinMPNN).• Data-Driven: Directly learns from the full PDB corpus.• Backbone-Sequence Decoupling: Specialized tools for each step. | • Black Box Nature: Hard to interpret or steer beyond conditioning.• Potential for "hallucinations": Structures may be unstable/unsynthesizable.• Training Data Bias: Biased toward well-represented folds in PDB.• Requires high-quality structural input (for ProteinMPNN). |
Detailed Experimental Protocols
Protocol: EvoDesign for Protein Stabilization
Objective: Optimize the sequence of a target protein (e.g., a therapeutic enzyme) for enhanced thermostability while preserving function, as part of a thesis on EvoDesign protocol development.
Workflow:
- Input Preparation: Obtain the target protein's structure (Target.pdb) and its amino acid sequence.
- Homolog Collection: Use JackHMMER or MMseqs2 to search against the UniRef100 database. Iterate until convergence to build a deep, diverse MSA (
target.msa). - Evolutionary Coupling Analysis: Process the MSA with plmDCA or GREMLIN to compute a co-evolutionary potential, identifying coupled residue pairs.
- Energy Function Construction: Combine the evolutionary potential with a physical force field (e.g., Rosetta's REF2015) or a statistical potential into a composite objective function:
E_total = w_evo * E_evo + w_phys * E_phys. - In-silico Sequence Optimization:
a. Fixed Backbone Design: Use Monte Carlo simulated annealing or a linear programming solver to sample amino acid identities minimizing
E_total. b. Backbone Relaxation: Allow slight backbone movements (side-chain and backbone minimization) around the designed sequence to relieve clashes. - Output & Analysis: Generate a ranked list of designed sequences. Analyze conservation, frustration, and in-silico stability metrics (e.g., ΔΔG fold).
Title: EvoDesign Protein Stabilization Workflow
Protocol:De NovoBinder Design with RFdiffusion & ProteinMPNN
Objective: Design a novel mini-protein binder to a target epitope.
Workflow:
- Target Specification: Define the target epitope structure (
epitope.pdb). Decide on binder topology (e.g., hairpin, helical bundle). - Conditional Backbone Generation with RFdiffusion:
a. Format the epitope as a "motif" for inpainting or use a conditional symmetry.
b. Run RFdiffusion with appropriate conditioning (e.g.,
inference.input_pdb=epitope.pdb,contigmap.paramsdefining the length and placement of the de novo chain). c. Generate hundreds of candidate backbone scaffolds (scaffold_*.pdb). - Backbone Filtering: Clustering based on RMSD and secondary structure content. Select top -10 diverse, well-folded scaffolds.
- Sequence Design with ProteinMPNN:
a. For each selected scaffold, run ProteinMPNN in batch mode.
b. Use default or fixed backbone sampling to generate multiple sequences per scaffold.
c. Output designed sequence-structure pairs (
designed_*.pdb,seqs_*.fa). - In-silico Validation: Perform short, fast relaxations using Rosetta or AlphaFold2 to predict folding and binding confidence (pLDDT, ipTM, interface energy).
Title: RFdiffusion + ProteinMPNN Binder Design Pipeline
The Scientist's Toolkit: Research Reagent Solutions
Table 3: Essential Materials & Tools for Protein Design Experiments
| Item / Reagent | Function / Purpose | Example in Protocol |
|---|---|---|
| High-Performance Computing (HPC) Cluster / Cloud GPU | Provides necessary CPU/GPU power for MSA generation, deep learning inference, and molecular dynamics. | Running plmDCA (CPU), RFdiffusion (GPU). |
| Multiple Sequence Alignment Database (UniRef100/90) | Comprehensive, non-redundant protein sequence database for building MSAs and evolutionary models. | Input for JackHMMER in EvoDesign. |
| Rosetta Software Suite | Industry-standard macromolecular modeling software for energy function calculation, sequence design, and relaxation. | Providing physical potential, backbone relaxation, and ΔΔG calculations. |
| AlphaFold2 or ColabFold | Protein structure prediction tool for in-silico validation of designed sequences. | Predicting if a ProteinMPNN-designed sequence will fold into the intended scaffold. |
| PyMOL or ChimeraX | Molecular visualization software for analyzing and rendering protein structures and interfaces. | Visualizing designed scaffolds from RFdiffusion and analyzing binding interfaces. |
| Cloning & Expression Kit (e.g., NEB HiFi Assembly, T7 Expression) | Molecular biology reagents for synthesizing genes, cloning into expression vectors, and producing protein in E. coli. | Moving from in-silico sequences to physical proteins for experimental validation. |
| Size-Exclusion Chromatography (SEC) Column | Analytical tool to assess protein monomericity, oligomeric state, and aggregation propensity. | First experimental test of proper folding for expressed designs. |
| Differential Scanning Fluorimetry (DSF) Plate | High-throughput assay to measure protein thermal stability (Tm). | Assessing success of EvoDesign stabilization protocol. |
| Surface Plasmon Resonance (SPR) Chip (e.g., Series S CM5) | Biosensor for quantifying binding kinetics (KD, kon, koff) of designed binders to immobilized target. | Validating affinity of RFdiffusion/ProteinMPNN-generated binders. |
Leveraging AlphaFold2/3 for Rapid In Silico Validation of Designed Proteins
Within the broader thesis on the EvoDesign protocol for protein optimization, a critical bottleneck has been the experimental validation of designed variants. EvoDesign uses evolutionary constraints and force-field calculations to generate stable, functional protein sequences. This application note details the integration of AlphaFold2 (AF2) and AlphaFold3 (AF3) as rapid, high-throughput in silico validation tools post-EvoDesign, significantly narrowing the candidate pool for costly wet-lab experiments.
Application Notes: Integrating AF2/3 into the EvoDesign Workflow
The primary application is the prediction of 3D structures for EvoDesign-generated sequences to assess whether the design objectives (e.g., preserving a functional fold, introducing a binding pocket, stabilizing a conformation) are met computationally.
Key Validation Metrics from AF2/3 Outputs
The following quantitative metrics, derived from AF2/3 predictions, serve as primary validation criteria.
Table 1: Key AF2/3 Output Metrics for In Silico Validation
| Metric | Description | Interpretation in EvoDesign Context | Typical Threshold for Proceeding |
|---|---|---|---|
| pLDDT (per-residue) | Local Confidence Score (0-100). | High scores (>90) indicate well-folded, stable regions. Low scores (<50) suggest disorder or misfolding in the design. | Global mean pLDDT > 80; functional sites > 85. |
| pTM (predicted TM-score) | Global fold confidence (0-1). | Measures similarity to the intended/input fold. pTM > 0.8 suggests a correct overall topology. | pTM > 0.7 for scaffold preservation. |
| PAE (Predicted Aligned Error) | Matrix of expected distance error (Ångströms). | Assesses domain rigidity and relative positioning. A compact, low-error plot indicates a stable, single-domain design. | Low inter-domain error (<10Å) for designed interfaces. |
| pLDDT at Mutated Sites | Confidence at EvoDesign-modified residues. | Directly evaluates if introduced mutations destabilize the local environment. | >70 for non-critical residues; >85 for active/binding sites. |
| AF3: Interface pTM (ipTM) | Confidence in complex prediction. | For EvoDesign of protein-protein or protein-ligand interactions, validates interface quality. | ipTM > 0.6 for intended complex formation. |
Comparative Advantages of AF2 vs. AF3 in Validation
AlphaFold2: Best for monomeric or single-chain protein validation. Provides the established pLDDT/pTM/PAE metrics. Highly reliable for assessing fold preservation. AlphaFold3: Essential for validating EvoDesign projects involving complexes (protein-protein, protein-peptide, protein-antibody, protein-small molecule). The ipTM and interface PAE are critical for validating designed interactions.
Detailed Experimental Protocols
Protocol: High-Throughput AF2 Validation ofEvoDesignVariants
Objective: Rank 100s of EvoDesign-generated sequences by predicted fold quality.
Materials & Software:
- Input: Multi-FASTA file of designed sequences.
- Hardware: Local GPU cluster (e.g., NVIDIA A100) or access to Google Cloud Batch with AF2.
- Software: Local AF2 installation (OpenSource) or ColabFold.
Procedure:
- Sequence Preparation: Generate a Multi-FASTA file (
designs.fasta) of all EvoDesign candidates, including the native sequence as control. - MSA Generation: Use MMseqs2 (via ColabFold) to generate multiple sequence alignments for each design. Limit database search to 5-10 minutes per sequence for speed.
- Structure Prediction: Run AF2 in no-template mode with
--model-type=monomer. Use--num-recycle=3(standard). Enable--amberrelaxation for final models. - Output Parsing: Extract for each design:
- Mean pLDDT from
scores.json. - pTM score from
scores.json. - PAE matrix from
model_*.pklfiles.
- Mean pLDDT from
- Analysis: Rank designs by mean pLDDT and pTM. Visually inspect top 20-30 models in PyMOL/ChimeraX, focusing on PAE and mutated regions.
Protocol: AF3 Validation of a Designed Protein-Ligand Complex
Objective: Validate an EvoDesign-engineered enzyme pocket for a target small molecule.
Materials & Software:
- Input: Protein sequence (FASTA) and ligand SMILES string.
- Platform: AlphaFold Server (https://alphafoldserver.com).
Procedure:
- Input Preparation: Define the protein sequence. In the "Add other molecules" section, input the SMILES string of the target ligand.
- Job Submission: Run prediction with default settings (no templates). The server handles all complex assembly steps.
- Output Analysis: Critically assess:
- ipTM Score: Primary metric for overall complex accuracy.
- Ligand-specific PAE: Examine the error matrix row/column corresponding to the ligand. Low error (<5 Å) indicates high confidence in ligand placement.
- Visual Inspection: Load the best-ranked model. Verify ligand pose matches the designed binding geometry (hydrogen bonds, hydrophobic contacts).
- Decision: Proceed with experimental testing only if ipTM > 0.65 and visual inspection confirms the designed interactions.
Visualization: Integrated Workflow
Diagram Title: AF2/3 Validation Pipeline for EvoDesign Variants
The Scientist's Toolkit
Table 2: Essential Research Reagent Solutions for AF2/3 Validation
| Item | Function & Relevance | Example/Provider |
|---|---|---|
| ColabFold | Cloud-based, accelerated pipeline combining MMseqs2 and AF2/AlphaFold-Multimer. Enables rapid screening without local hardware. | GitHub: "sokrypton/ColabFold" |
| AlphaFold Server | Official, free platform for AlphaFold3 predictions, including proteins, ligands, nucleic acids. Critical for complex validation. | https://alphafoldserver.com |
| PyMOL/ChimeraX | Molecular visualization software. Essential for visual inspection of predicted models, PAE plots, and ligand binding poses. | Schrodinger LLC / UCSF RBVI |
| pLDDT & PAE Parsing Scripts | Custom Python scripts to batch-extract quantitative metrics from AF2/3 output JSON and PKL files for analysis. | Biopython, Pandas libraries |
| MMseqs2 Server | Ultra-fast protein sequence searching for generating multiple sequence alignments (MSAs), the critical first input step for AF2. | https://search.mmseqs.com |
| Local AF2 Installation | For high-throughput, secure, or customized predictions on an institutional GPU cluster. | OpenSource from DeepMind on GitHub |
| Reference Structure (PDB) | The original scaffold or target complex structure. Serves as a visual and metric (RMSD) benchmark for the EvoDesign outcome. | Protein Data Bank (RCSB) |
1. Introduction Within the broader thesis on the EvoDesign protocol for protein optimization research, a critical analysis compares two primary strategies: the generative de novo design of proteins from scratch and the functional optimization of existing protein scaffolds. This application note details the quantitative success metrics, provides experimental protocols, and contextualizes findings for research and therapeutic development.
2. Data Summary: Success Rate Metrics Success is quantified by experimental validation of designed proteins, typically measured by expression yield, structural fidelity (via crystallography or cryo-EM), and functional activity (e.g., enzymatic turnover, binding affinity).
Table 1: Comparative Success Rates in Published Studies (2020-2024)
| Metric | De Novo Design | Functional Optimization (incl. EvoDesign) | Notes |
|---|---|---|---|
| Experimental Fold Rate | ~10-25% | ~40-70% | Percentage of designs that adopt the intended fold/structure. |
| High-Activity Hit Rate | ~1-15% | ~20-50% | Percentage of designs exhibiting intended function at a useful level. |
| Median Affinity Improvement (Kd) | Not Applicable | 10-1000 fold | For binder design/optimization campaigns. |
| Typical Development Timeline | 6-18 months | 3-9 months | From initial design to validated construct. |
| Key Limitation | Requires precise energy function; function is emergent. | Limited by starting scaffold properties. |
3. Detailed Experimental Protocols
Protocol 3.1: EvoDesign-Based Functional Optimization Workflow Objective: Optimize a protein (e.g., an enzyme or binder) for enhanced stability, affinity, or expression using the EvoDesign protocol which integrates evolutionary sequence information with atom-level force fields.
Input Scaffold Preparation:
- Obtain the 3D structure (PDB file) of the target protein scaffold.
- If the wild-type structure is unavailable, generate a high-quality homology model.
- Define the "fixed" regions (structural core) and "designable" regions (e.g., binding interface, flexible loops).
Evolutionary Coupling Analysis:
- Perform a PSI-BLAST search against the NR database (E-value < 0.001) to build a Multiple Sequence Alignment (MSA) of homologous sequences.
- Use tools like CCMpred or GREMLIN to identify evolutionarily coupled residue pairs. These couplings define a statistical potential favoring native-like sequences.
Computational Design Simulation:
- Integrate the evolutionary potential with a physical force field (e.g., Rosetta REF15) in the EvoDesign energy function:
E_total = w_evo * E_evolutionary + w_phys * E_physical. - Run Monte Carlo simulations with simulated annealing to sample sequence space in designable regions, minimizing
E_total. - Output a rank-ordered list of ~100-500 designed variant sequences.
- Integrate the evolutionary potential with a physical force field (e.g., Rosetta REF15) in the EvoDesign energy function:
In Silico Filtering:
- Filter designs for stability (ddG < 0, predicted by FoldX or Rosetta), absence of aggregation motifs, and favorable binding energy (if applicable).
- Select top 20-50 designs for experimental testing.
Experimental Validation:
- Proceed to Protocol 3.3 for expression and purification.
- Characterize variants using methods outlined in Protocol 3.4.
Protocol 3.2: De Novo Protein Design Workflow Objective: Design a novel protein fold or motif not observed in nature.
Target Backbone Specification:
- Define the desired secondary structure topology and fold (e.g., α-helical bundle, β-sandwich).
- Generate idealized backbone coordinates using parametric equations or fragment assembly (e.g., using RosettaRemodel).
Sequence Design on Fixed Backbone:
- Use a rotamer-based sequence optimization algorithm (e.g., RosettaDesign, RFdiffusion+ProteinMPNN) to find a low-energy amino acid sequence for the target backbone.
- The energy function is purely physics-based (
E_physical).
In Silico Validation:
- Perform full-atom molecular dynamics (MD) simulations (≥100 ns) to assess fold stability.
- Use deep learning predictors like AlphaFold2 or RoseTTAFold to predict the structure of the designed sequence. Success is indicated by high confidence (pLDDT > 85) and a close match to the target backbone (TM-score > 0.8).
Experimental Validation:
- Proceed to Protocol 3.3 & 3.4. Due to lower fold rates, typically 50-200 designs are synthesized in parallel for de novo projects.
Protocol 3.3: High-Throughput Expression & Purification Objective: Produce and purify designed protein variants in a 96-well format.
- Materials: Codon-optimized gene fragments (cloned into pET vectors), BL21(DE3) E. coli cells, TB autoinduction media, 96-well deep-well plates, nickel-NTA resin plates, liquid handling robot.
- Transform plasmids into expression cells. Inoculate 1.2 mL cultures in deep-well plates. Grow at 37°C to OD600 ~0.6, then induce/shift to 18°C for 18-24 hrs.
- Pellet cells by centrifugation. Lyse via chemical (lysis buffer) or mechanical (sonication) methods.
- Clarify lysates by filtration. Perform immobilized metal affinity chromatography (IMAC) using a 96-well filter plate pre-filled with Ni-NTA resin.
- Elute with imidazole buffer. Analyze purity by SDS-PAGE. Pool positive hits for further characterization.
Protocol 3.4: Characterization of Designed Proteins Objective: Assess structural integrity and functional activity.
- Size-Exclusion Chromatography (SEC): Analyze 100 µg of purified protein on a Superdex 75 Increase column. A monodisperse, symmetric peak at the expected elution volume indicates proper folding and homogeneity.
- Circular Dichroism (CD) Spectroscopy: Measure far-UV spectra (190-250 nm) to confirm secondary structure content matches design predictions.
- Surface Plasmon Resonance (SPR): For binding designs, immobilize the target ligand on a CMS chip. Measure binding kinetics (ka, kd) and affinity (KD) of purified designs across a concentration series.
- Enzymatic Activity Assay: Use a fluorescence- or absorbance-based substrate specific to the target enzyme function. Measure initial velocities to determine kcat/KM.
4. Visualizations
EvoDesign Functional Optimization Protocol
Strategy Comparison: Pros and Cons
5. The Scientist's Toolkit: Key Reagent Solutions
| Item | Function in Experiment |
|---|---|
| Rosetta Software Suite | Primary computational platform for energy-based protein design and structure prediction. |
| Nickel-NTA Agarose Resin | Standard affinity resin for rapid purification of His-tagged designed proteins. |
| Cytiva Biacore T200 SPR System | Gold-standard for label-free, quantitative analysis of binding kinetics and affinity. |
| Jasco J-1500 CD Spectrophotometer | Measures circular dichroism to confirm secondary structure of designed proteins. |
| Superdex 75 Increase 10/300 GL SEC Column | Analyzes oligomeric state and monodispersity of purified designs. |
| Codon-Optimized Gene Fragments (Twist Bioscience) | High-throughput, accurate synthesis of dozens to hundreds of design sequences. |
| TB Autoinduction Media | Enables high-density bacterial protein expression without manual induction. |
| Protease Inhibitor Cocktail (EDTA-free) | Prevents proteolytic degradation of designed proteins during cell lysis and purification. |
1. Introduction and Thesis Context
This application note is framed within the broader thesis that the EvoDesign protocol remains a critical, cost-effective methodology for protein optimization, particularly in scenarios where evolutionary constraints, stability, and functional folding are paramount. While newer deep learning (DL) tools like AlphaFold2, RFdiffusion, and ProteinMPNN offer unprecedented speed and design novelty, EvoDesign leverages natural evolutionary information to generate functional and stable variants, often at a lower computational and financial cost for specific applications. The choice is not binary but strategic, dependent on project goals, resources, and validation capacity.
2. Comparative Analysis: EvoDesign vs. Newer AI Tools
Table 1: Strategic and Quantitative Comparison of Protein Design Tools
| Criteria | EvoDesign Protocol | Newer AI Tools (e.g., RFdiffusion, ProteinMPNN) |
|---|---|---|
| Core Principle | Evolutionary constraints from homologous sequences. | Pattern recognition from protein structure databases. |
| Primary Output | Stable, functionally-optimized variants near the natural sequence space. | Novel folds, binders, and motifs, potentially far from natural sequences. |
| Computational Cost | Moderate (requires MSA generation, but less intensive than DL training/inference). | Can be very high (requires GPU clusters for large-scale generation/sampling). |
| Data Dependency | Requires a deep Multiple Sequence Alignment (MSA). | Requires large, high-quality structural databases (e.g., PDB). |
| Success Rate (Stability) | High for stabilizing existing folds. | Variable; high novelty can correlate with folding failures. |
| Typical Time to Design | Hours to days (MSA-dependent). | Minutes to hours for single designs. |
| Validation Imperative | Medium-High (experimental validation required). | Very High (extensive in silico and experimental validation critical). |
| Ideal Use Case | Enzyme stability, thermostability, optimizing existing protein scaffolds for expression. | De novo binder design, novel enzyme active sites, symmetric assemblies. |
3. Application Notes: Decision Framework
Note 1: Choose EvoDesign When:
- Project Budget is Limited: EvoDesign runs efficiently on standard HPC CPUs without demanding premium GPU resources.
- Evolutionary Conservation is Key: For optimizing catalytic residues or protein-protein interfaces where nature's solutions are preferred.
- A Robust MSA Exists: For well-conserved protein families (e.g., TIM barrels, immunoglobulin folds), the evolutionary landscape is rich.
- Primary Goal is Enhanced Stability/Solubility: The protocol's force field emphasizes folding free energy.
Note 2: Choose Newer AI Tools When:
- Designing De Novo Structures or Binders: Targeting a novel shape or interface with no natural precedent.
- Speed and Scale are Primary: Generating thousands of candidate scaffolds rapidly.
- Structural Data is Abundant, but MSA is Sparse: For orphan folds or recently discovered protein classes.
Note 3: Hybrid Approach: A cost-effective strategy is using AI tools for initial de novo scaffold generation, followed by EvoDesign for subsequent stability and functional optimization of the best candidates.
4. Experimental Protocols
Protocol 1: Core EvoDesign Workflow for Protein Stabilization
- Objective: Generate stabilized variants of a target protein (e.g., a mesophilic enzyme) for heterologous expression.
- Input: Target protein sequence and/or structure (PDB ID).
- Steps:
- Homologous Sequence Collection: Use
jackhmmerorHHblitsagainst UniRef90 to build a deep MSA. Minimum threshold: 1000 non-redundant sequences. - Evolutionary Coupling Analysis: Process MSA with
CCMpredorplmcto identify co-evolving residue pairs. - Target Structure Preparation: If no structure exists, generate a high-confidence model using AlphaFold2.
- EvoDesign Simulation: Execute the EvoDesign protocol (
EvoDesign.pl). Key parameters:- Force field weights: 30% evolutionary fitness, 70% structure-based energy (fold-level).
- Simulation cycles: 50-100 Monte Carlo steps.
- Generate 50-100 design models.
- In Silico Filtering: Rank designs by calculated folding free energy (ΔΔG) using
FoldXorRosetta ddg_monomer. - Downstream Cloning & Validation: Proceed to Protocol 2.
- Homologous Sequence Collection: Use
Protocol 2: Experimental Validation of Designed Variants
- Objective: Express, purify, and assess stability of top EvoDesign and AI-generated variants.
- Materials: See "Scientist's Toolkit" below.
- Steps:
- Gene Synthesis & Cloning: Synthesize genes for top 5-10 designs and wild-type control. Clone into expression vector (e.g., pET series).
- Protein Expression: Transform into expression host (e.g., E. coli BL21(DE3)). Induce with 0.5 mM IPTG at 18°C for 16-18 hours.
- Purification: Purify via affinity chromatography (Ni-NTA for His-tagged proteins).
- Thermal Shift Assay: Use differential scanning fluorimetry. Mix 5 µM protein with SYPRO Orange dye. Ramp temperature from 25°C to 95°C at 1°C/min in a real-time PCR machine. Record melting temperature (Tm).
- Activity Assay: Perform standard enzymatic or binding assay specific to protein function.
- Data Analysis: Compare Tm and specific activity of designs vs. wild-type. Successful EvoDesign variants typically show a ΔTm increase of +5°C to +15°C with retained or improved activity.
5. Visualizations
Title: Decision Framework for Protein Design Tool Selection
Title: EvoDesign Core Computational Protocol
6. The Scientist's Toolkit
Table 2: Key Research Reagent Solutions for Validation
| Reagent / Material | Function in Protocol |
|---|---|
| pET Expression Vector | High-copy plasmid for T7-driven protein expression in E. coli. |
| E. coli BL21(DE3) Cells | Robust expression host with integrated T7 RNA polymerase gene for induction. |
| Ni-NTA Agarose Resin | Affinity chromatography medium for purifying polyhistidine (His)-tagged proteins. |
| SYPRO Orange Dye | Fluorescent dye that binds hydrophobic patches exposed during protein denaturation in thermal shift assays. |
| Imidazole | Competitor for His-tag binding; used for elution during purification and in wash buffers. |
| Size-Exclusion Chromatography Column | For final polishing step to remove aggregates and obtain monodisperse protein sample. |
Conclusion
The EvoDesign protocol remains a powerful and principled methodology for protein optimization, effectively bridging evolutionary wisdom with physical energy-based scoring. While newer deep learning tools offer speed and novelty, EvoDesign's strength lies in its interpretability and robust foundation in biophysics and evolution, making it exceptionally reliable for stability and affinity optimization tasks. The future of protein engineering lies in hybrid approaches, integrating EvoDesign's strengths with generative AI models like RFdiffusion for de novo backbone generation and AlphaFold for rapid validation. For biomedical research, mastering this protocol enables the rational design of superior therapeutic proteins, enzymes, and vaccines, accelerating the pipeline from computational blueprint to clinically viable candidate. Continued development should focus on automating parameter optimization and creating more seamless interfaces with experimental high-throughput screening data.